Install and config of ArgoCD for automated deployment of applications
Install ArgoCD
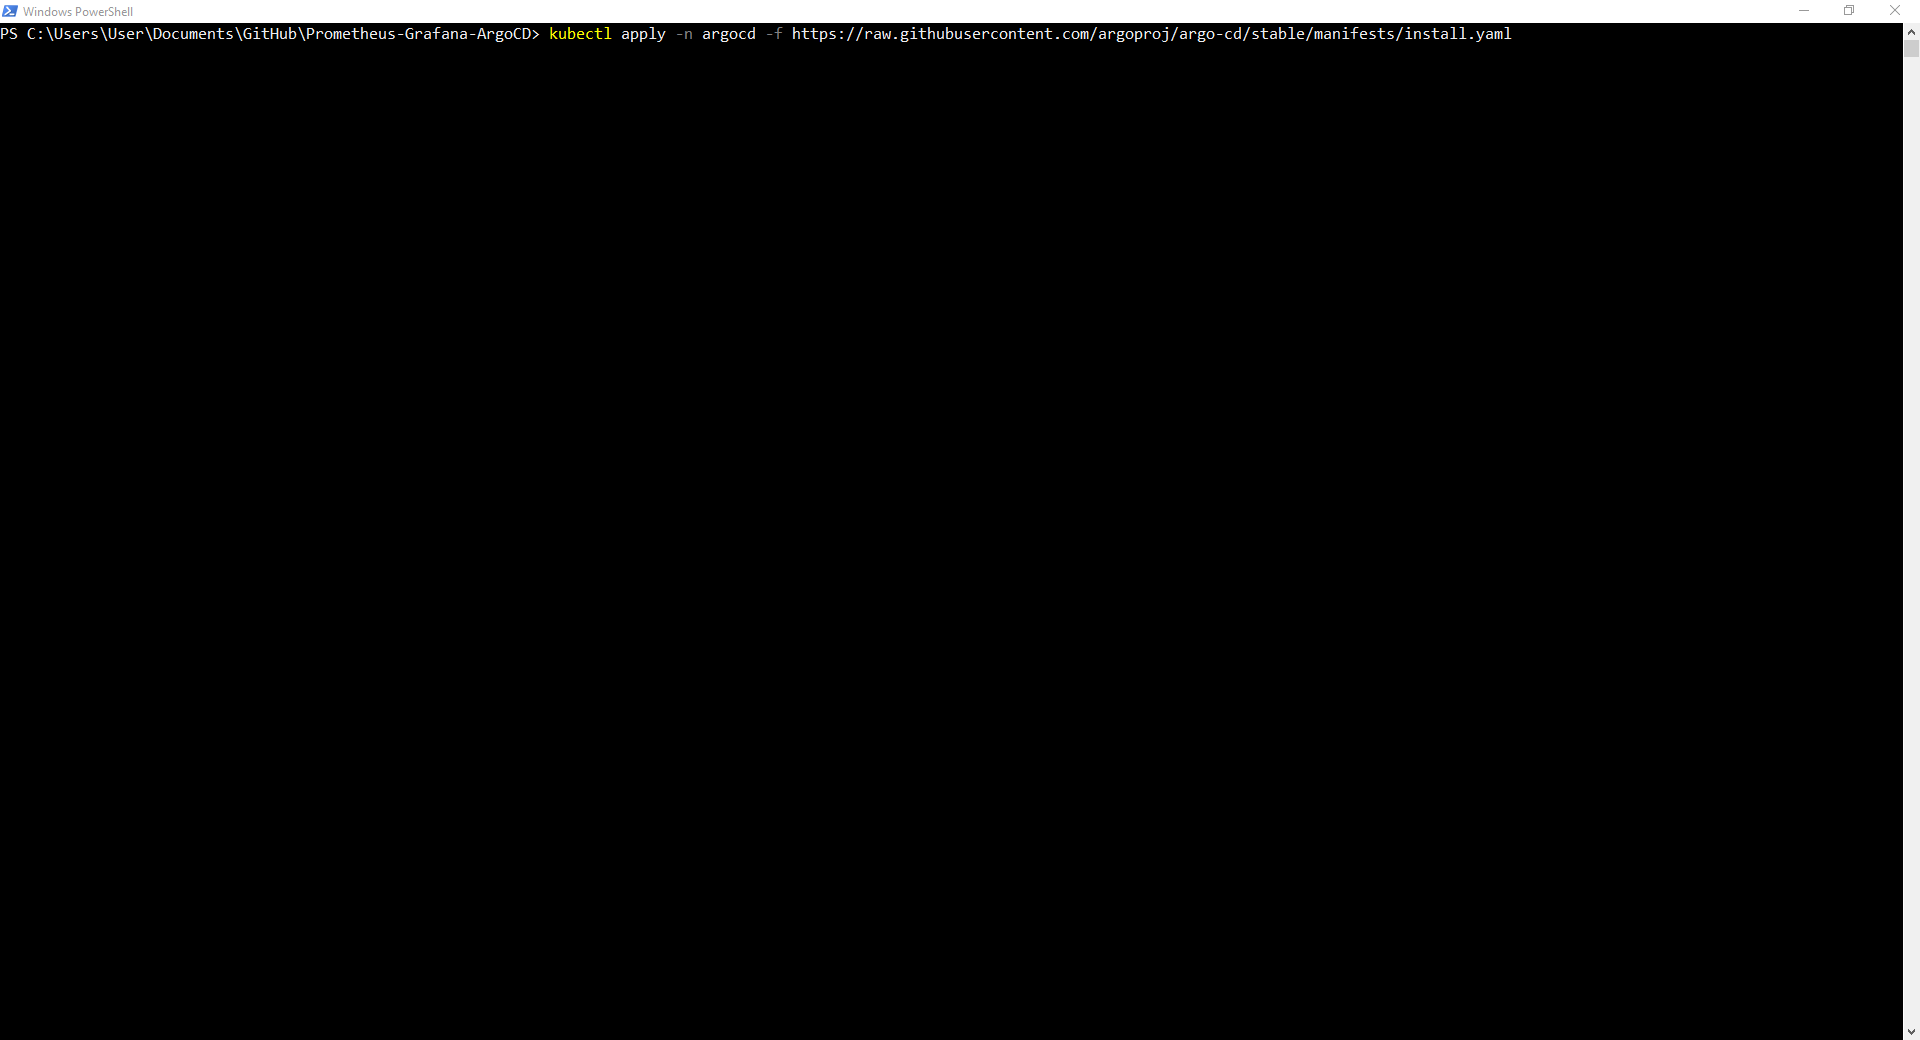
1. command to install ArgoCD on cluster
Command1: kubectl create namespace argocd
Command2: kubectl apply -n argocd -f https://raw.githubusercontent.com/argoproj/argo-cd/stable/manifests/install.yaml
Accessing ArgoCD Web Interface
1. Port Forward with access through localhost
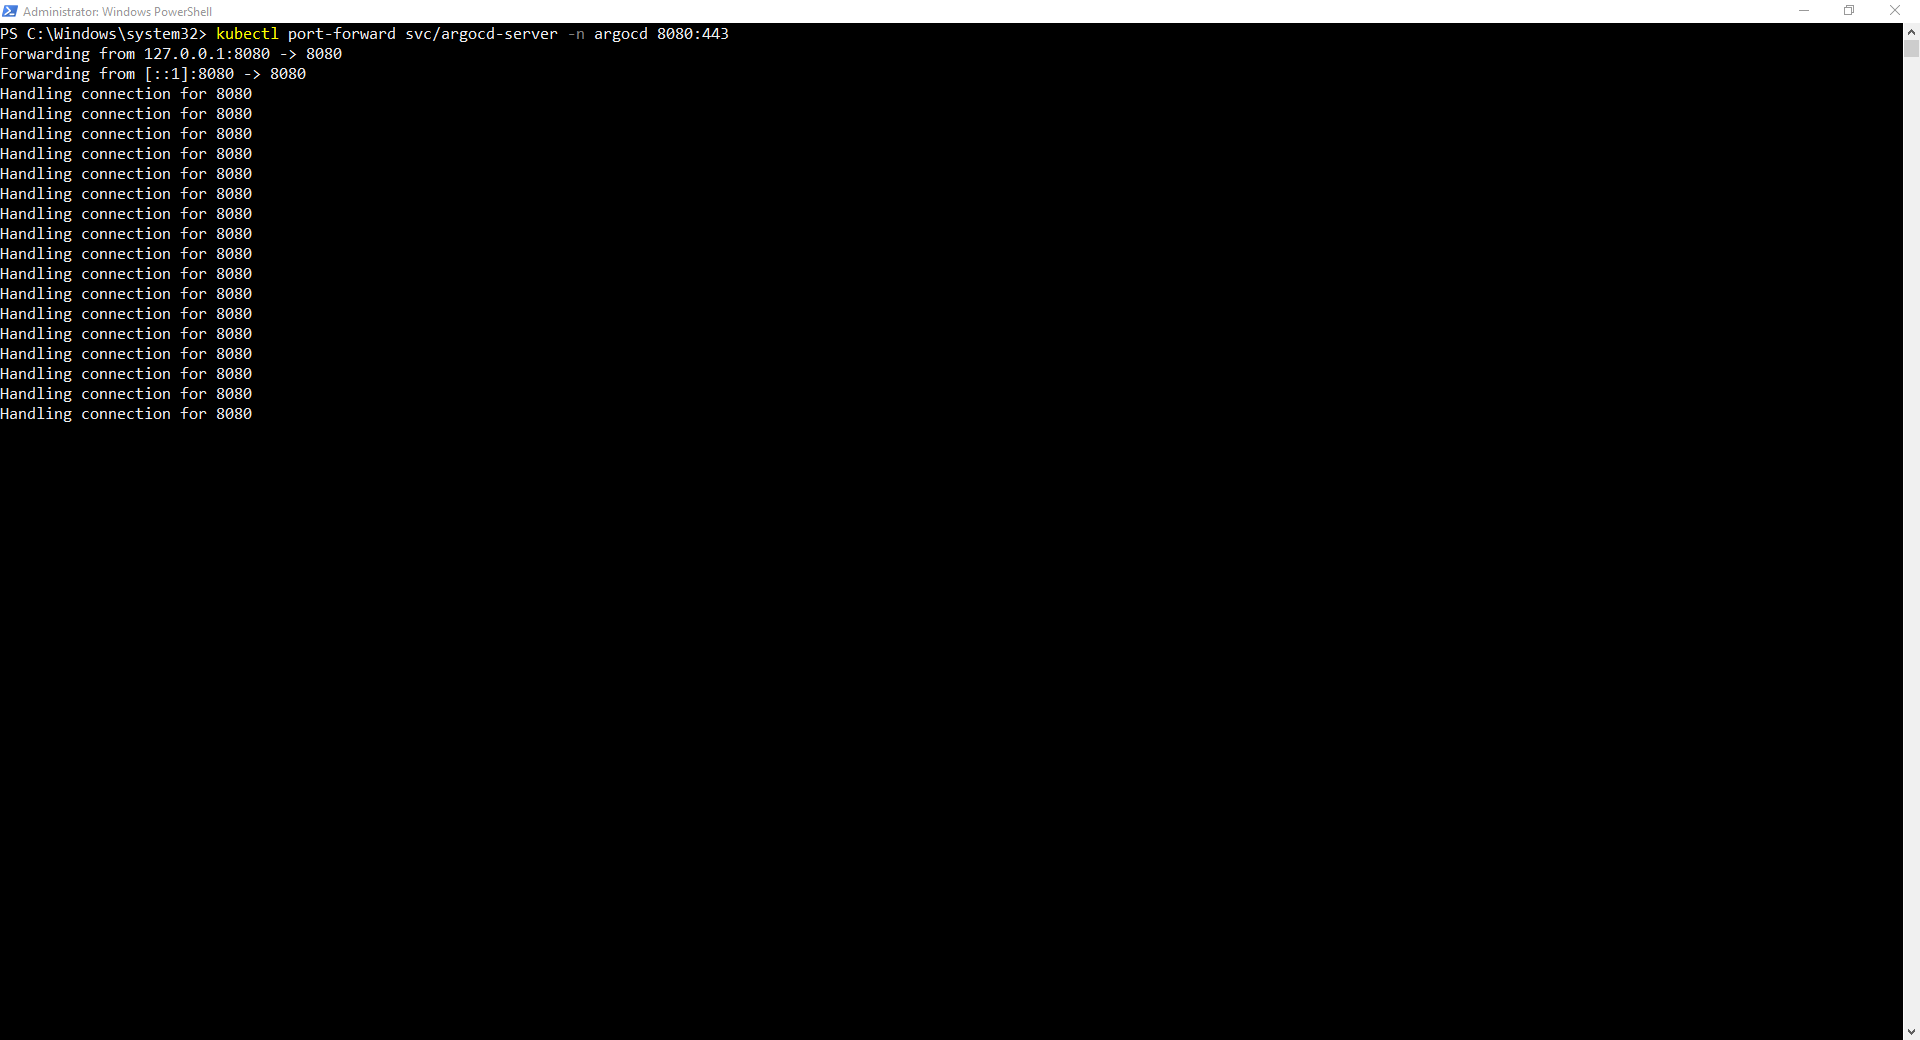
kubectl port-forward svc/argocd-server -n argocd 8080:443
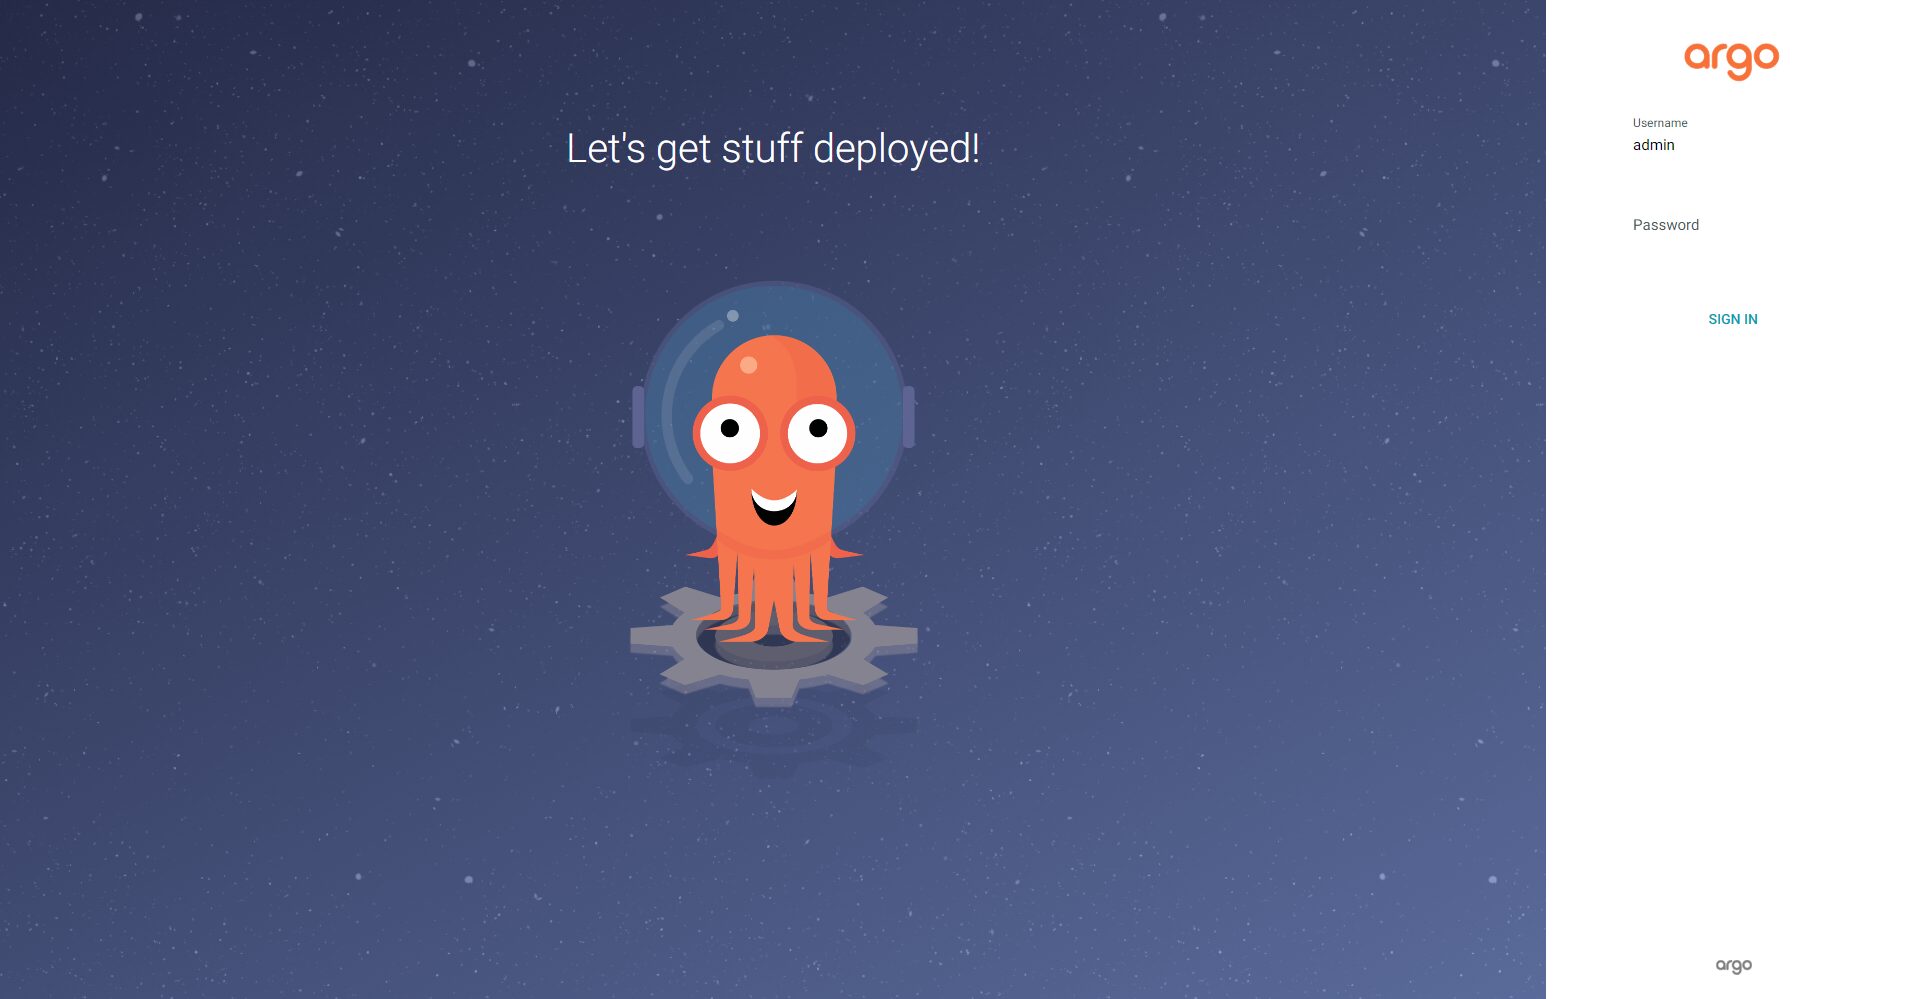
2. Open Web Interface in web browser by typing localhost:8080. The Argo Login Page will appear.
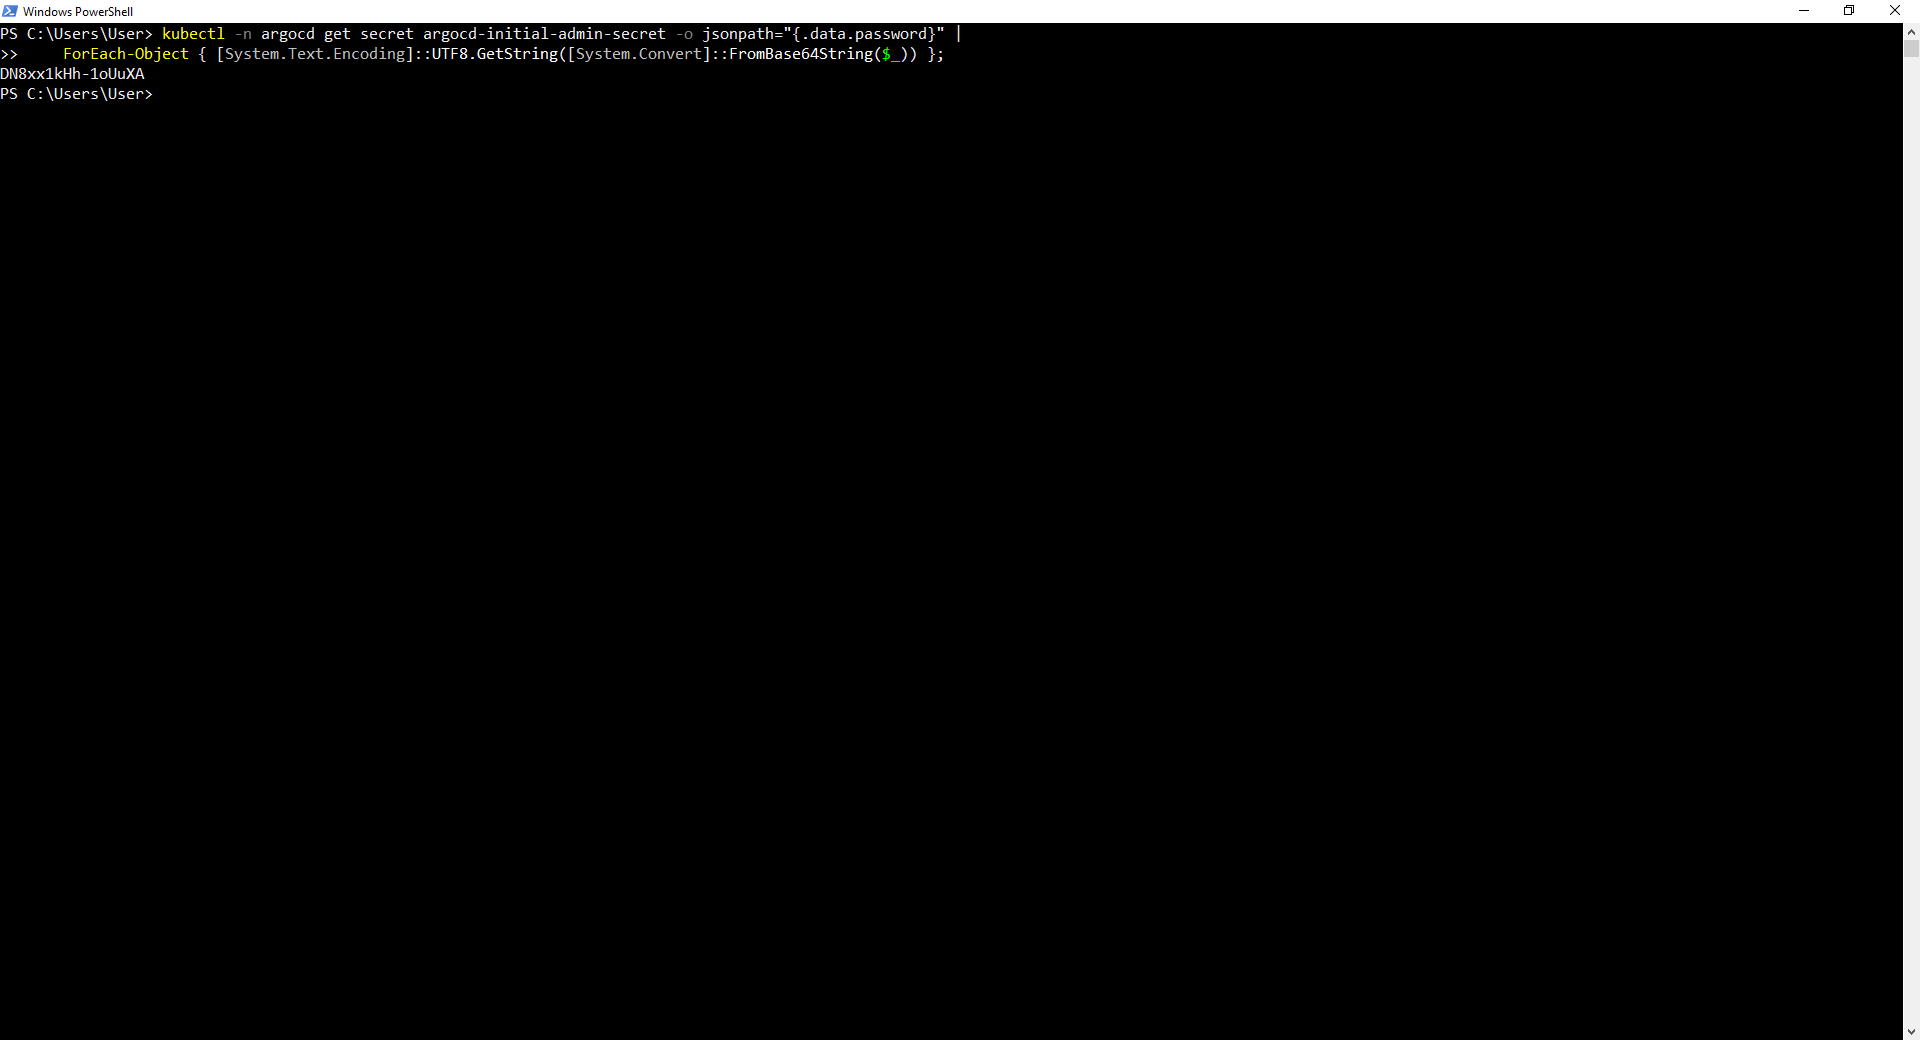
3. Type one of the following commands to get the password for login
Powershell Command: kubectl -n argocd get secret argocd-initial-admin-secret -o jsonpath="{.data.password}" |
>> ForEach-Object { [System.Text.Encoding]::UTF8.GetString([System.Convert]::FromBase64String($_)) };
Bash Command: kubectl -n argocd get secret argocd-initial-admin-secret -o jsonpath="{.data.password}" | base64 -d; echo
Connect Kubernetes Config to Application Repository
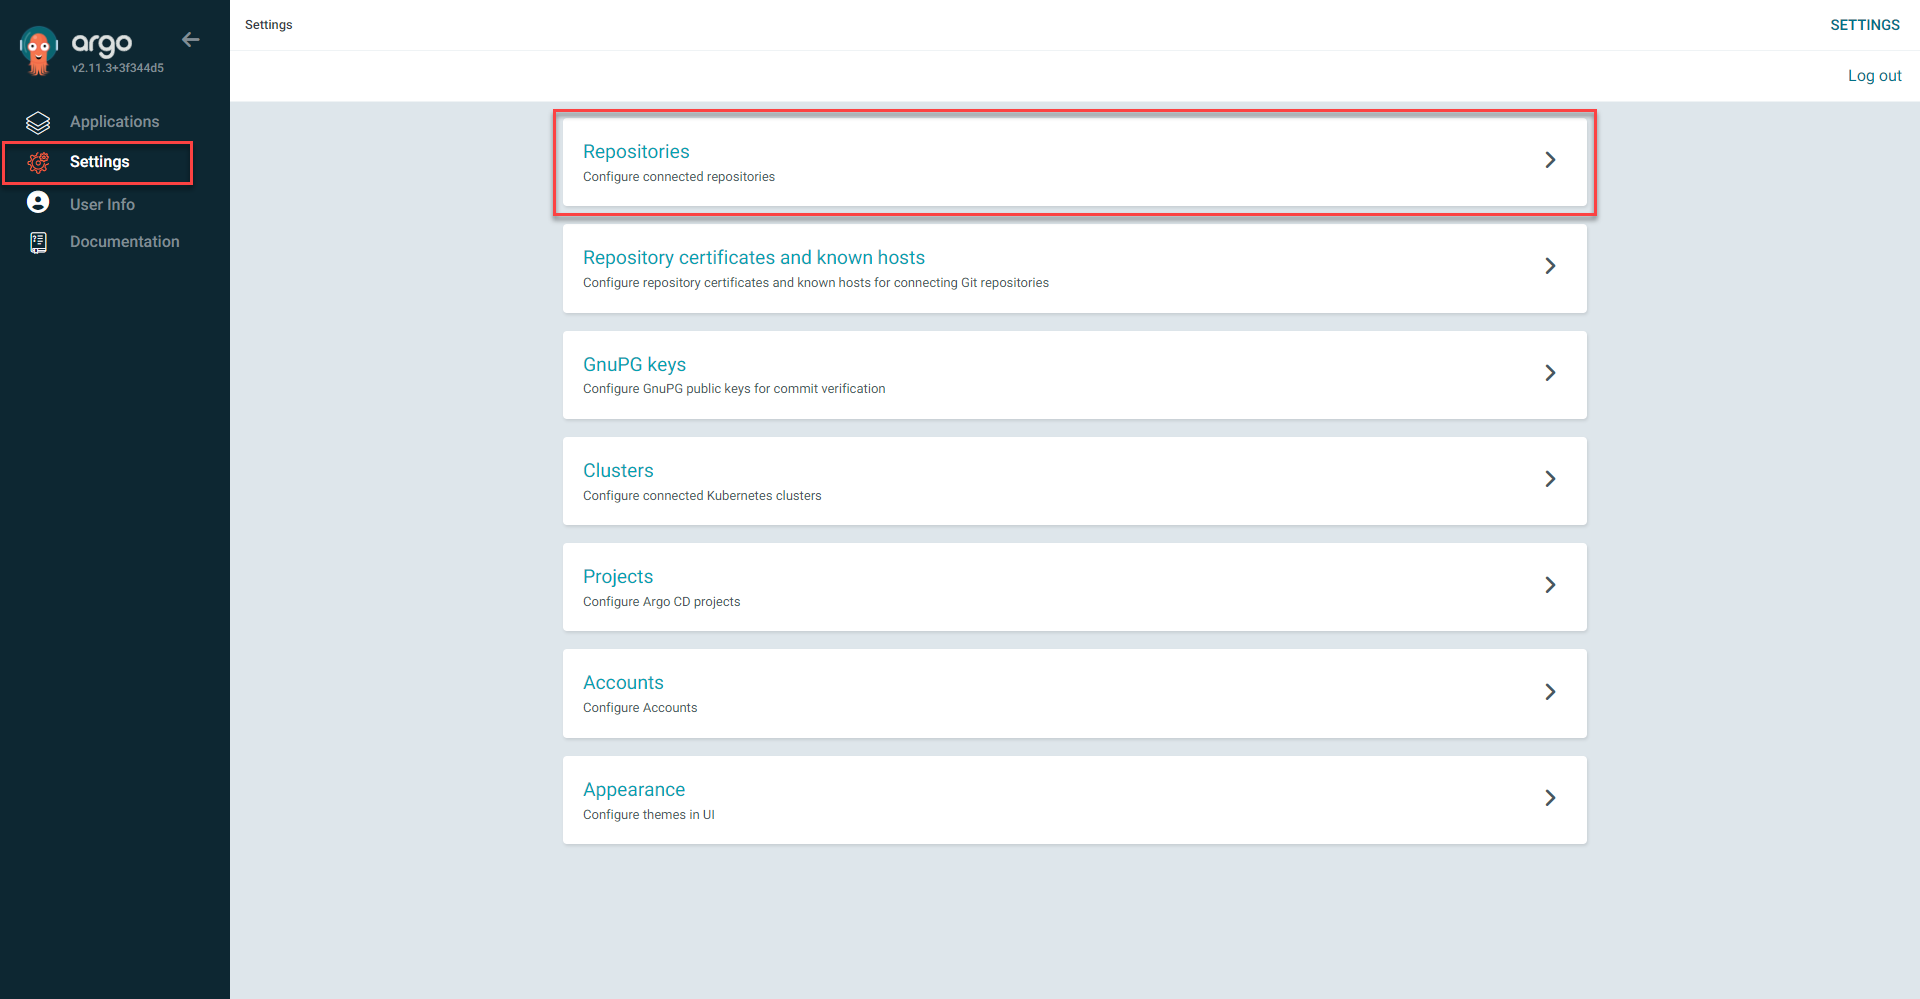
1. Select the Settings Page and select repositories from the menu.

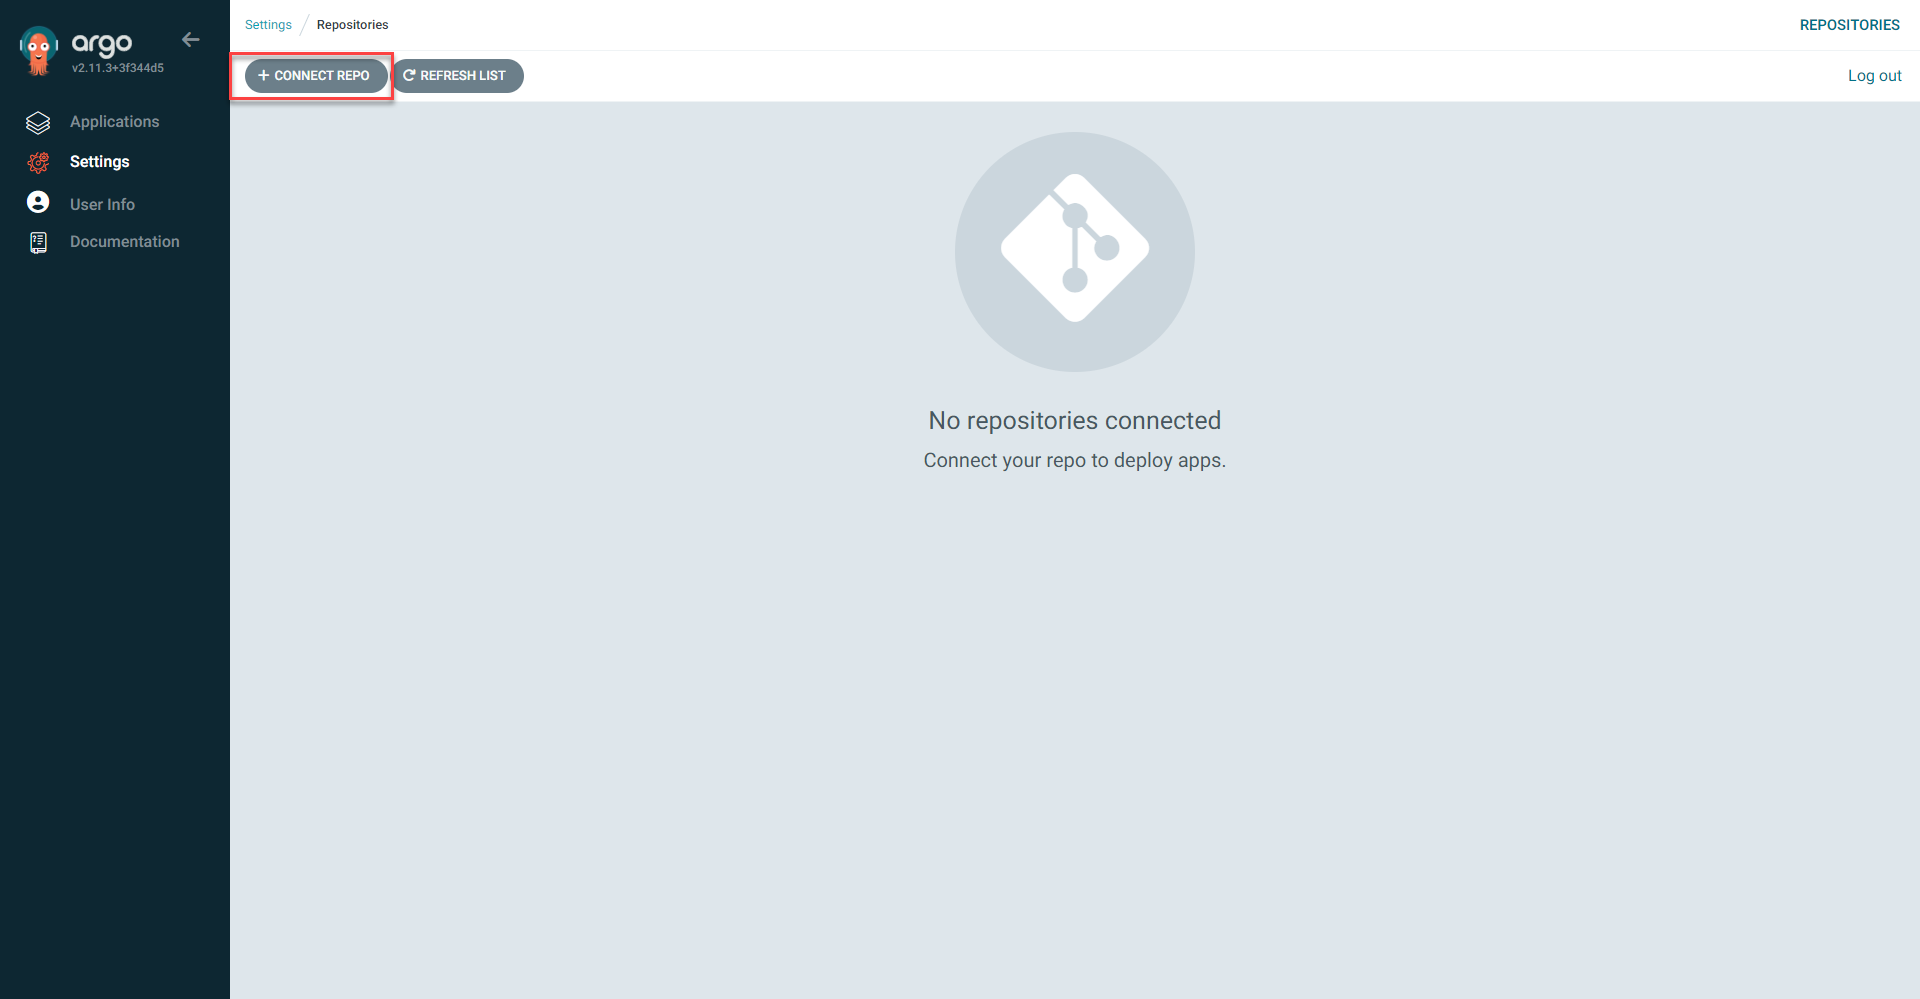
2. Select Connect Repo 
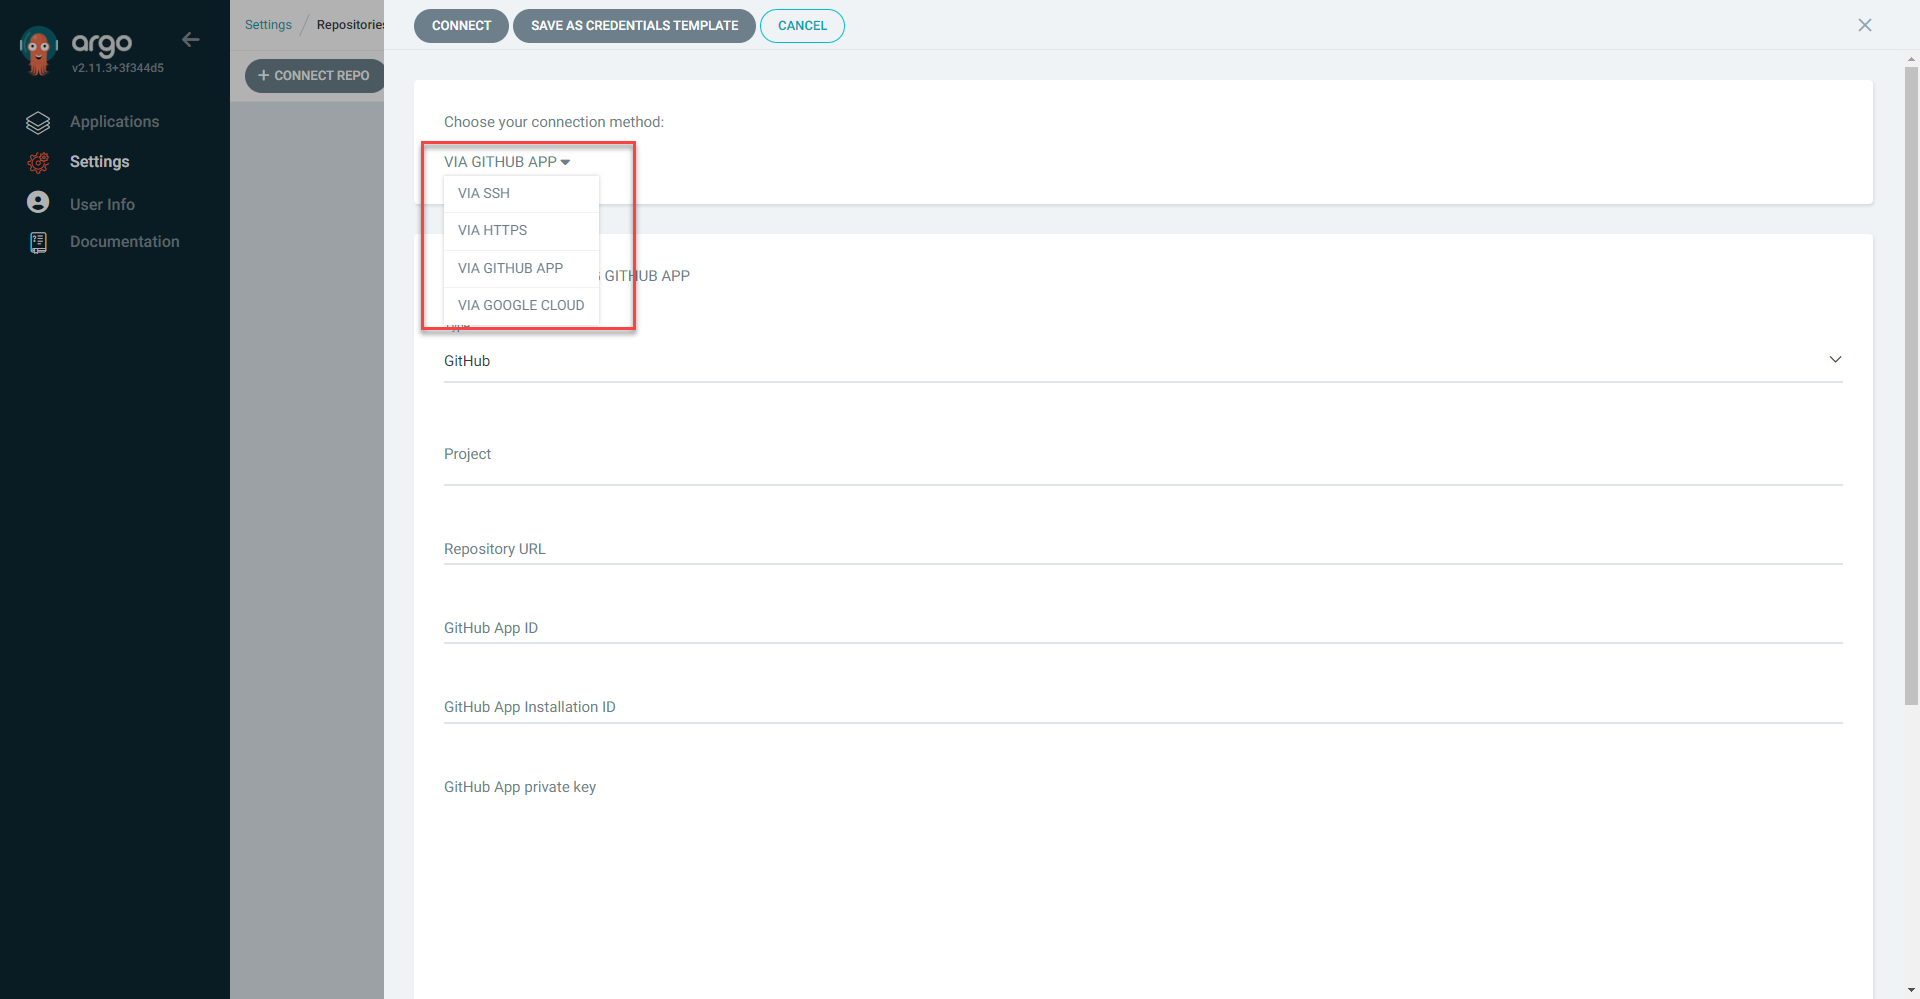
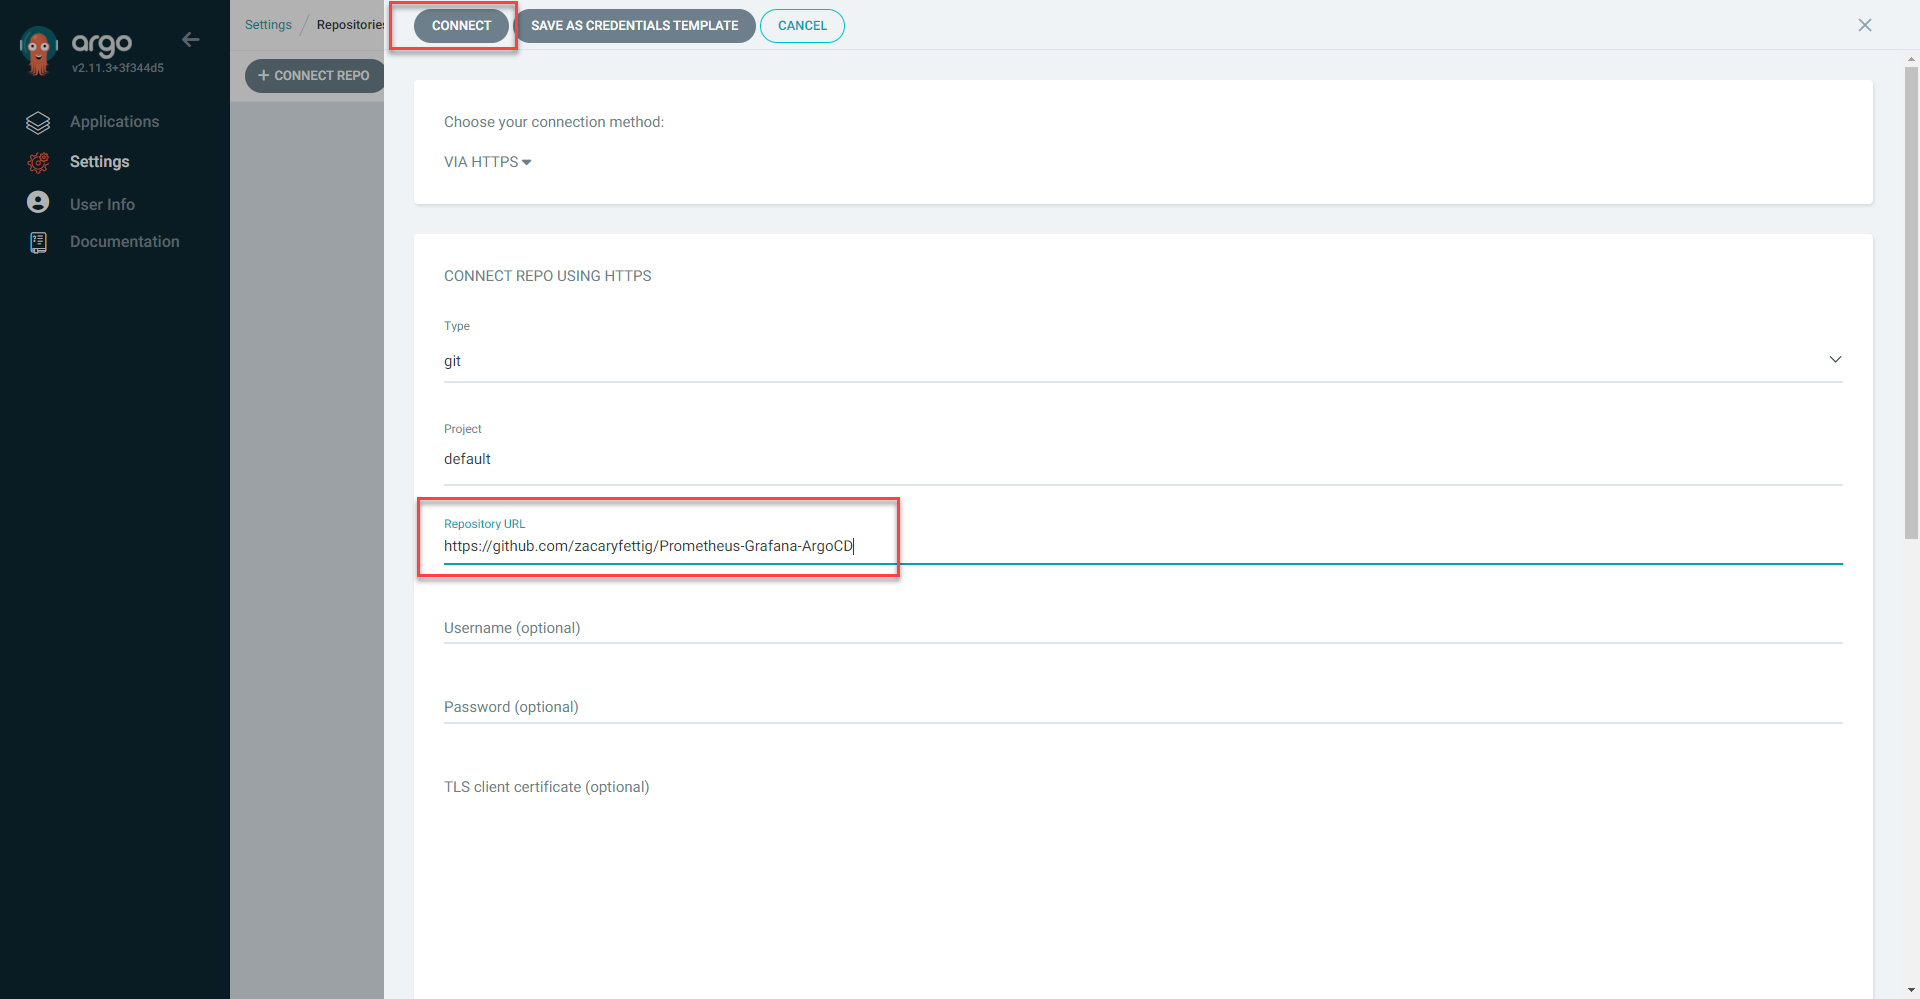
3. Select the connection method to your preferred repository hosting. In this instance GitHub Connection will be done via HTTPS
4. Add repository url. Select Connect 
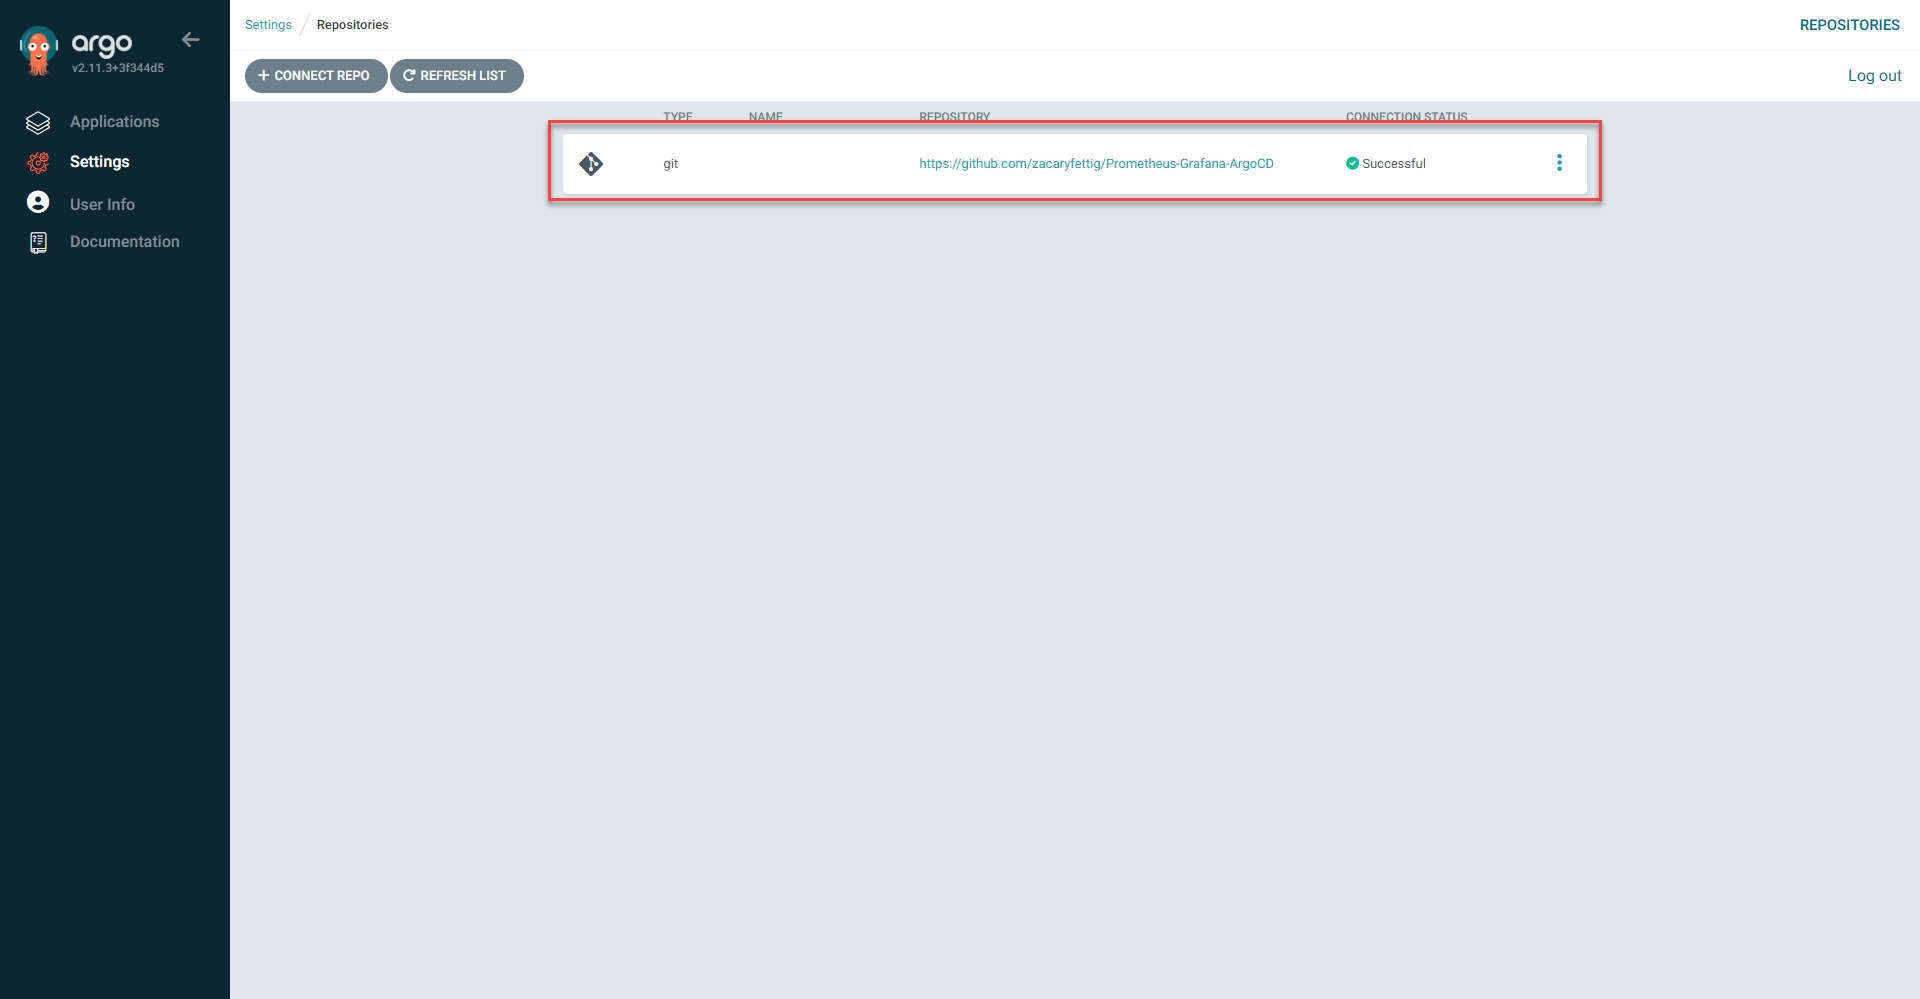
5. Connection Status will show green check mark once successful.
Deploy Prometheus/Grafana
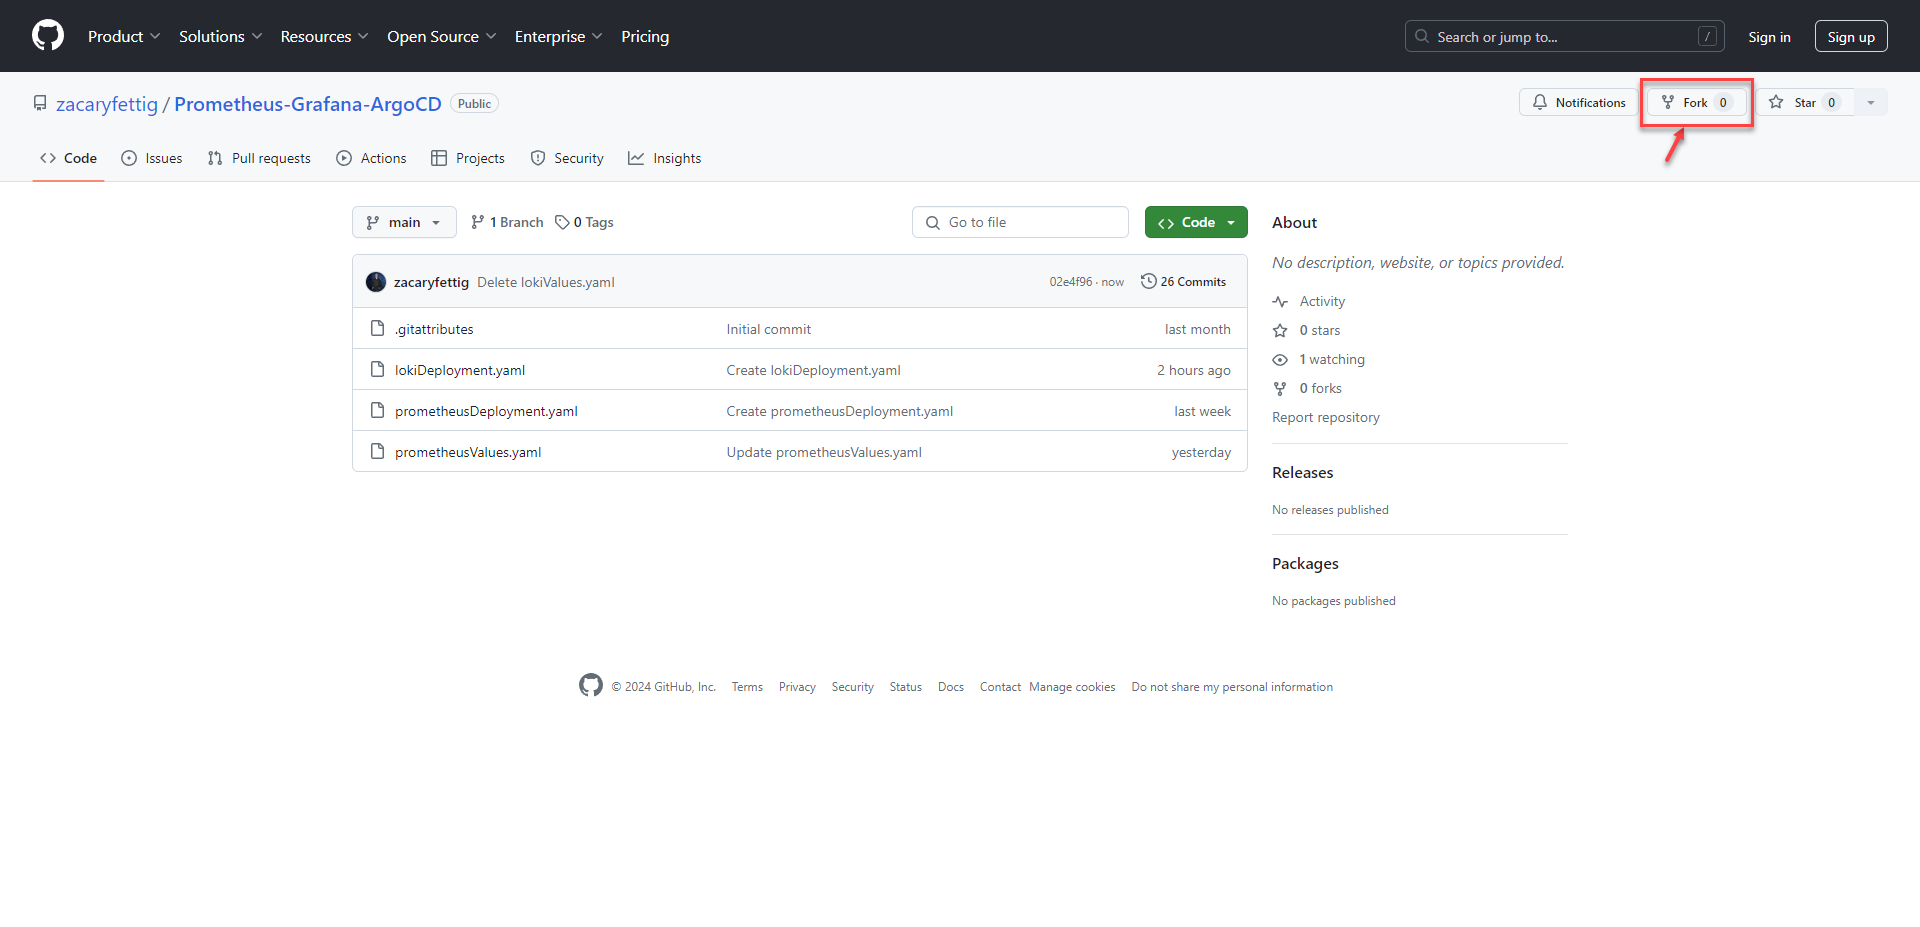
1. Fork the prometheusValues.yaml file from https://github.com/zacaryfettig/Prometheus-Grafana-ArgoCD. The yaml file will deploy the Prometheus stack that has Grafana built in. Check that the file is in the same directory. Argocd will pull the file in the deployment for use.
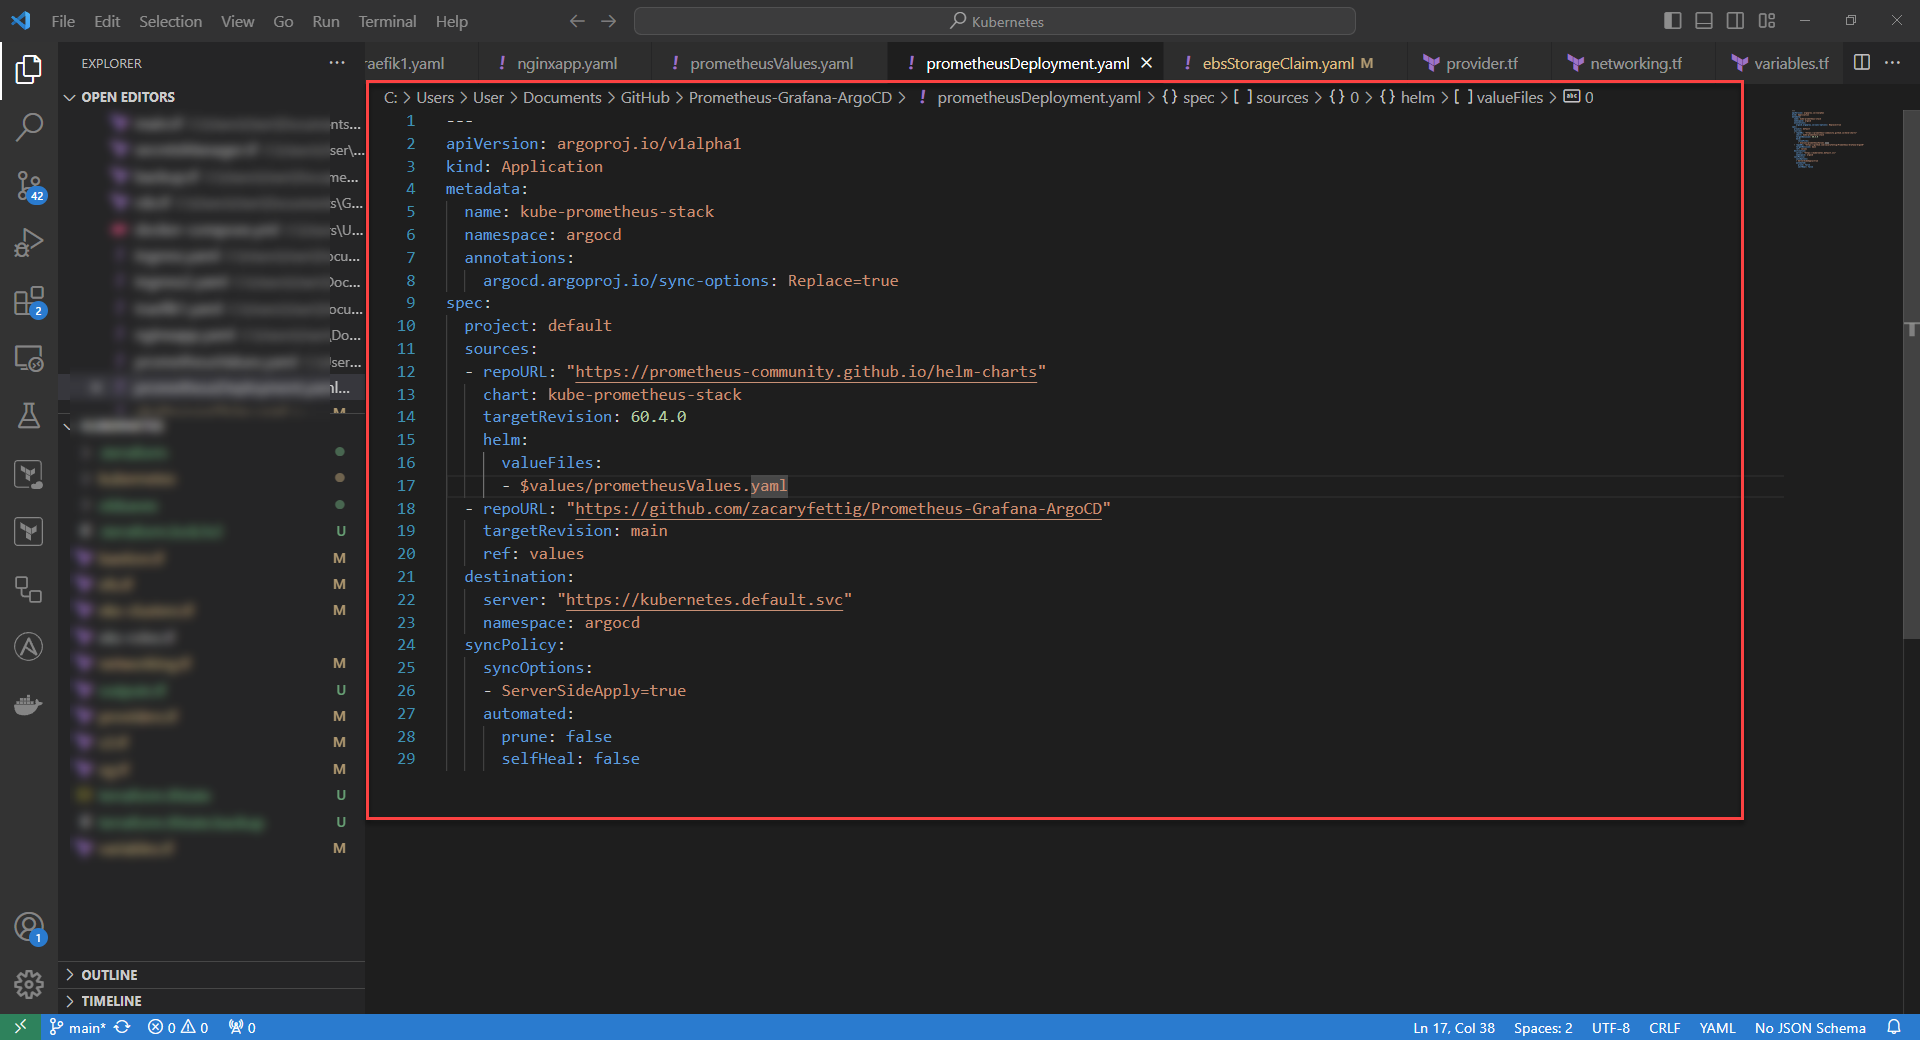
Note: The prometheusDeployment file provides the yaml to deploy the helm chart through argocd. The kind of the file is set as Application. The repo URL is set to the prometheus stack github charts page. The values file is set to a GitHub repository that I created to store the modified values file for the helm deployment.
3. Apply prometheus config
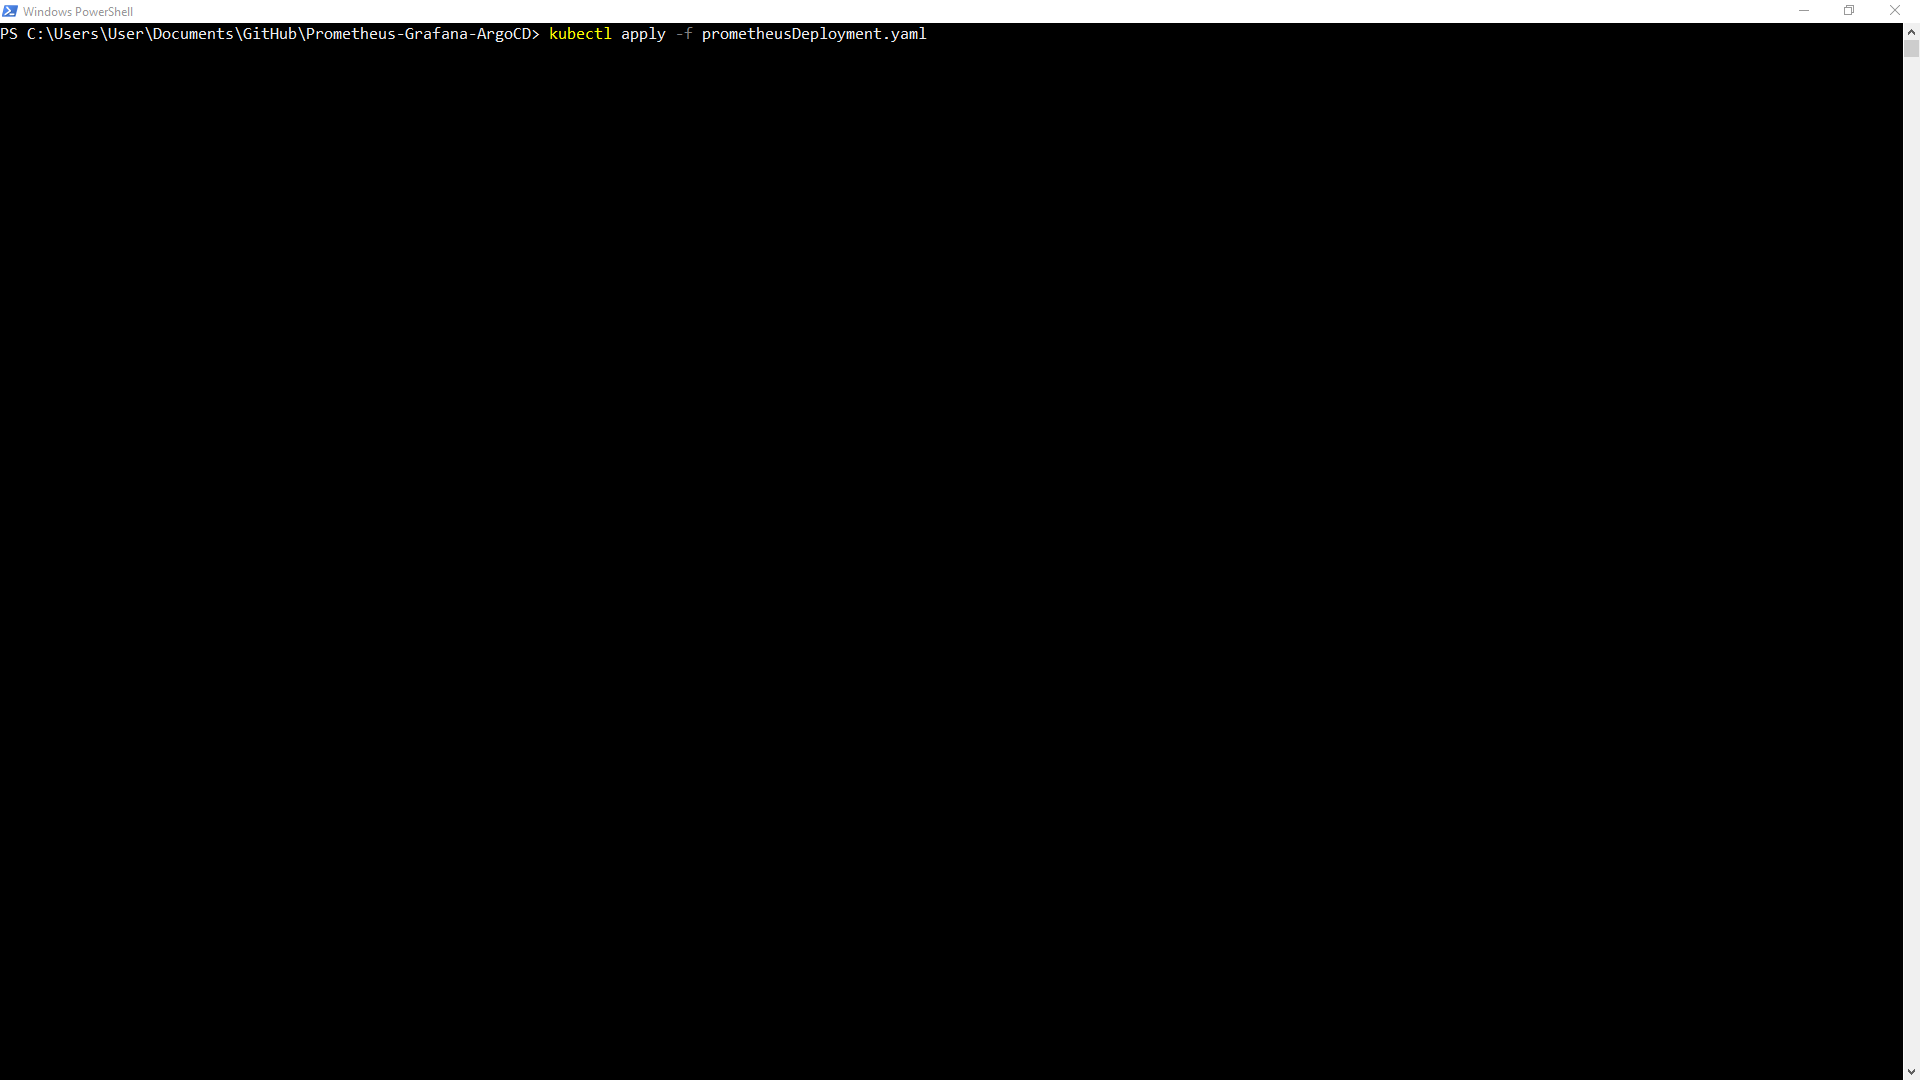
command: kubectl apply -f prometheusDeployment.yaml
Note: pods/services will be deployed to the argocd namespace. The deployment namespace can be changed with the namespace value under destination in the application file. The application namespace must stay the same in order for argocd to manage the application.


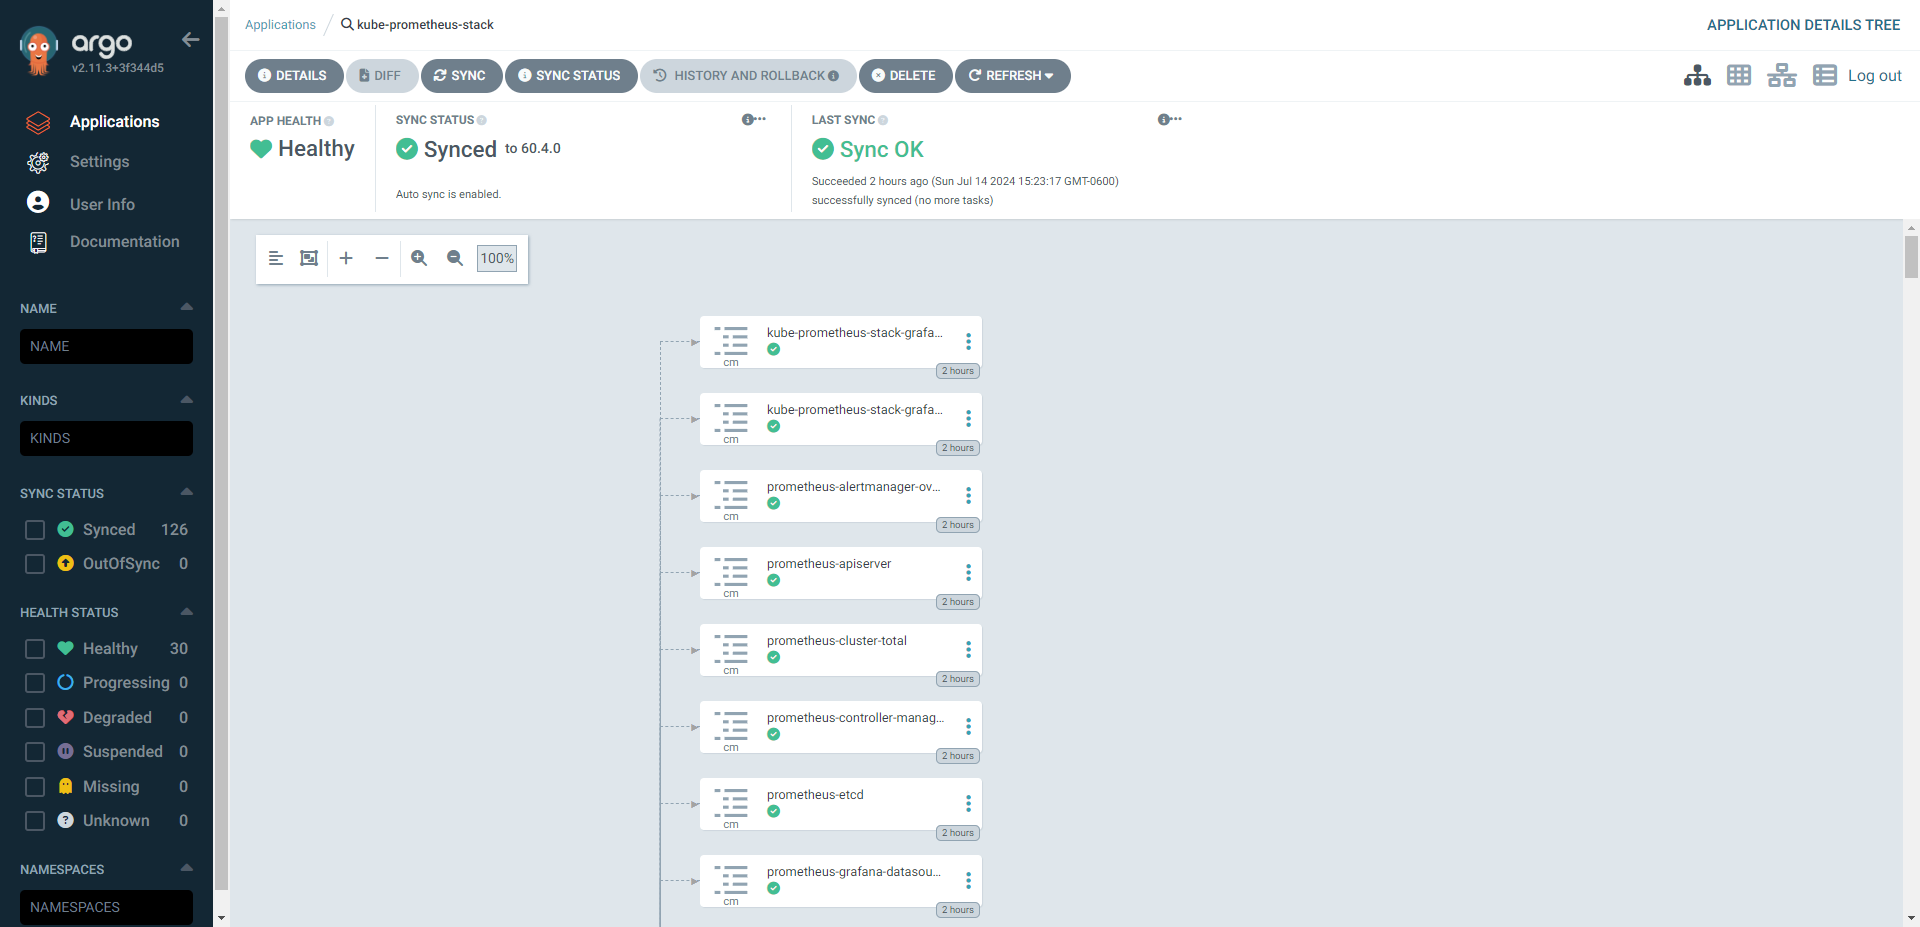
4. Application will sync and show health status in ArgoCD
Access Prometheus Web Interface
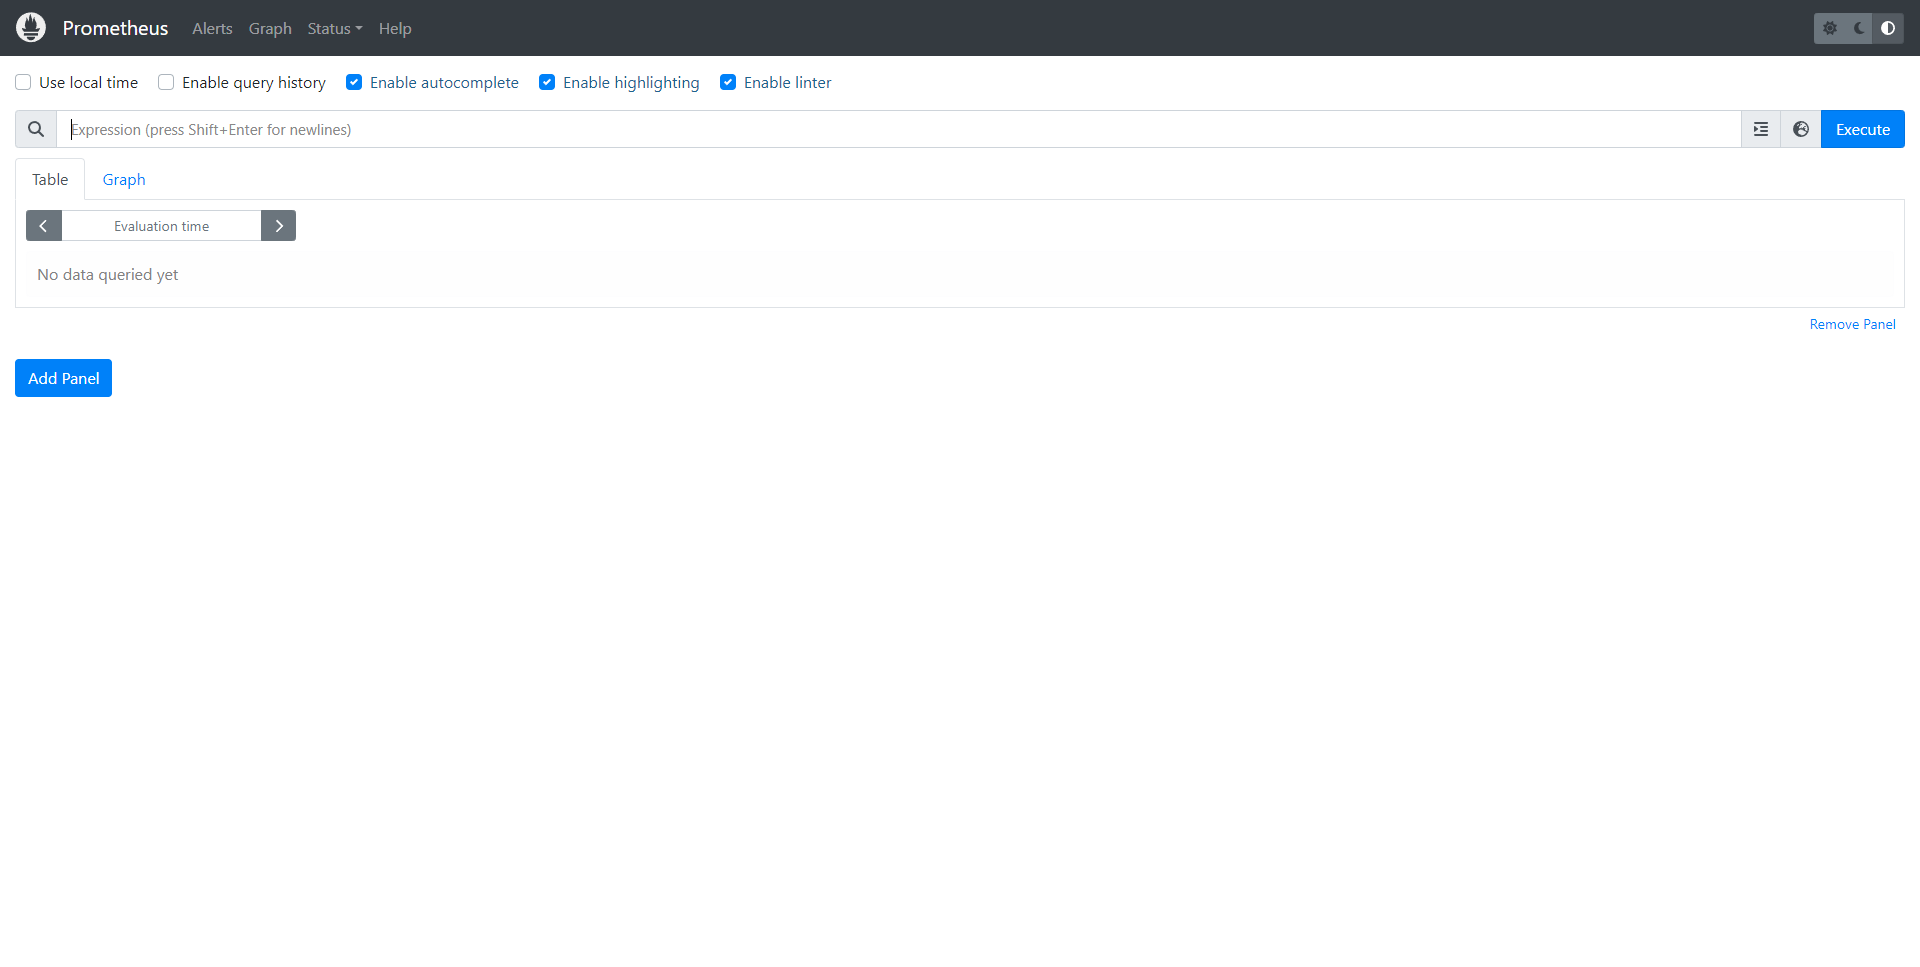
1. Prometheus dashboard runs on port 9090. The dashboard can be accessed by port forwarding or setting up an ingress to forward the traffic. 
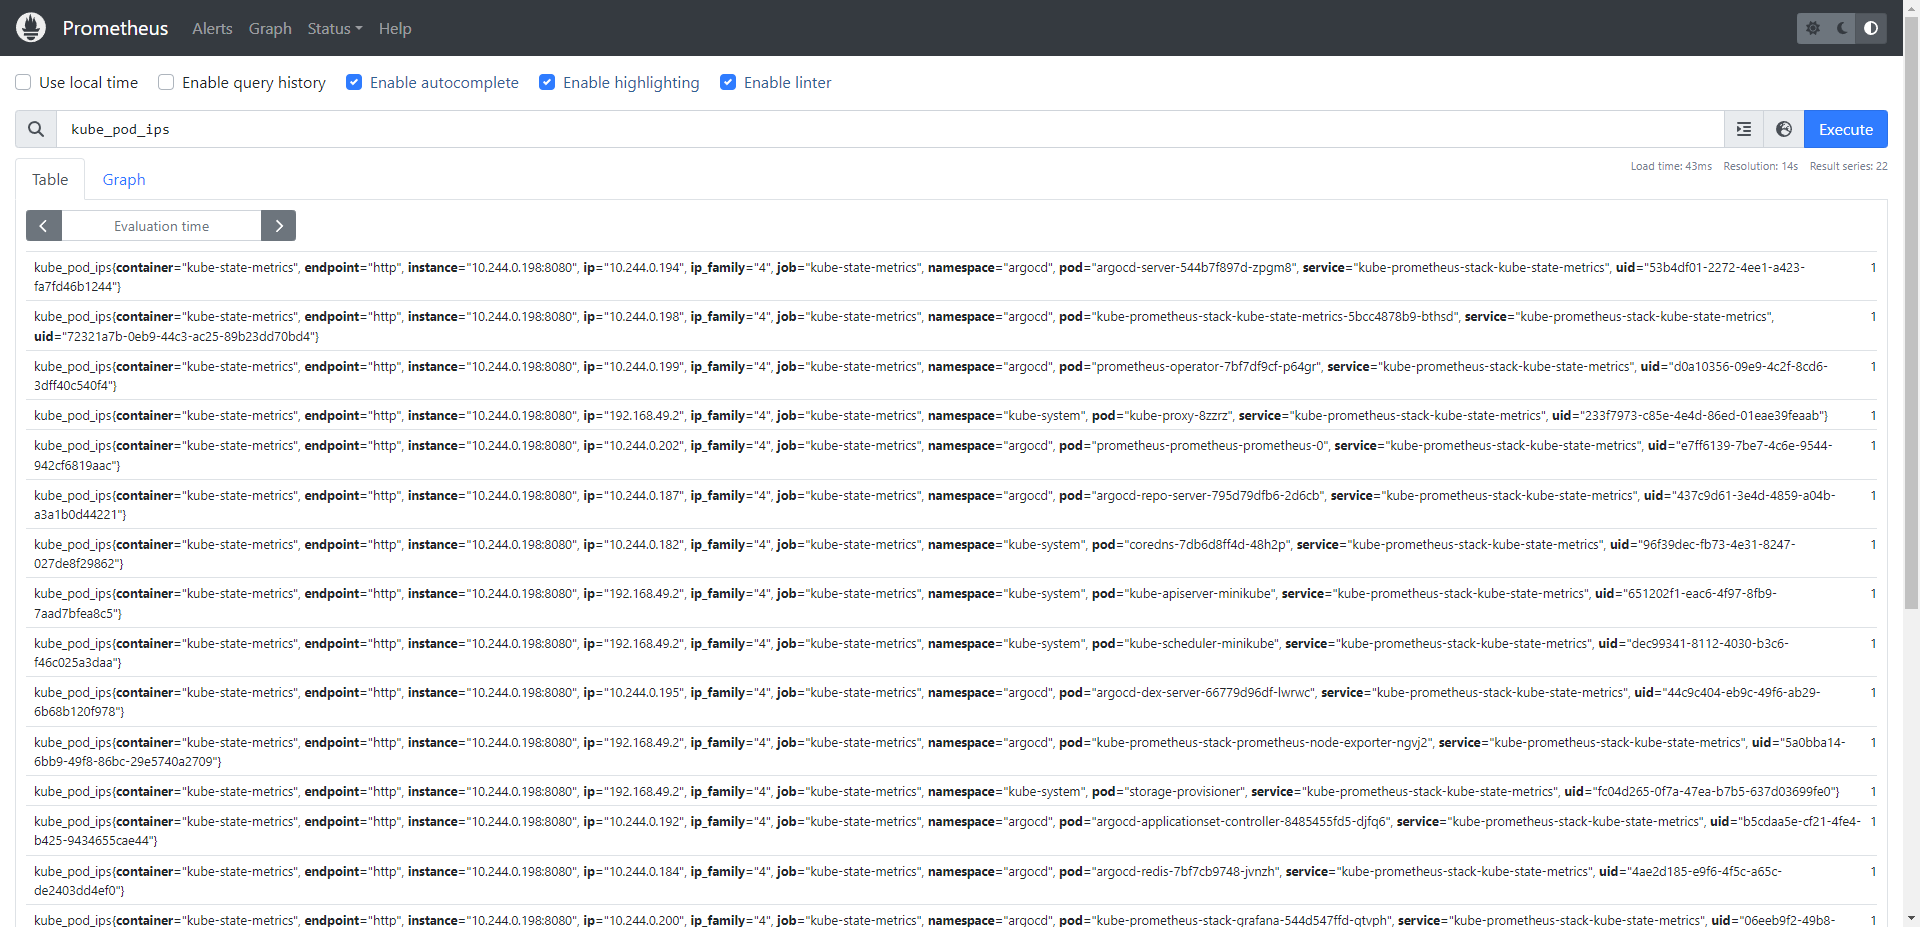
2. Prometheus Dashbaord can be used to query data about the cluster, show graph information, and see alerts based off of health status.
Access Grafana Web Interface
Note: Grafana will be the primary interface to interact with the data.
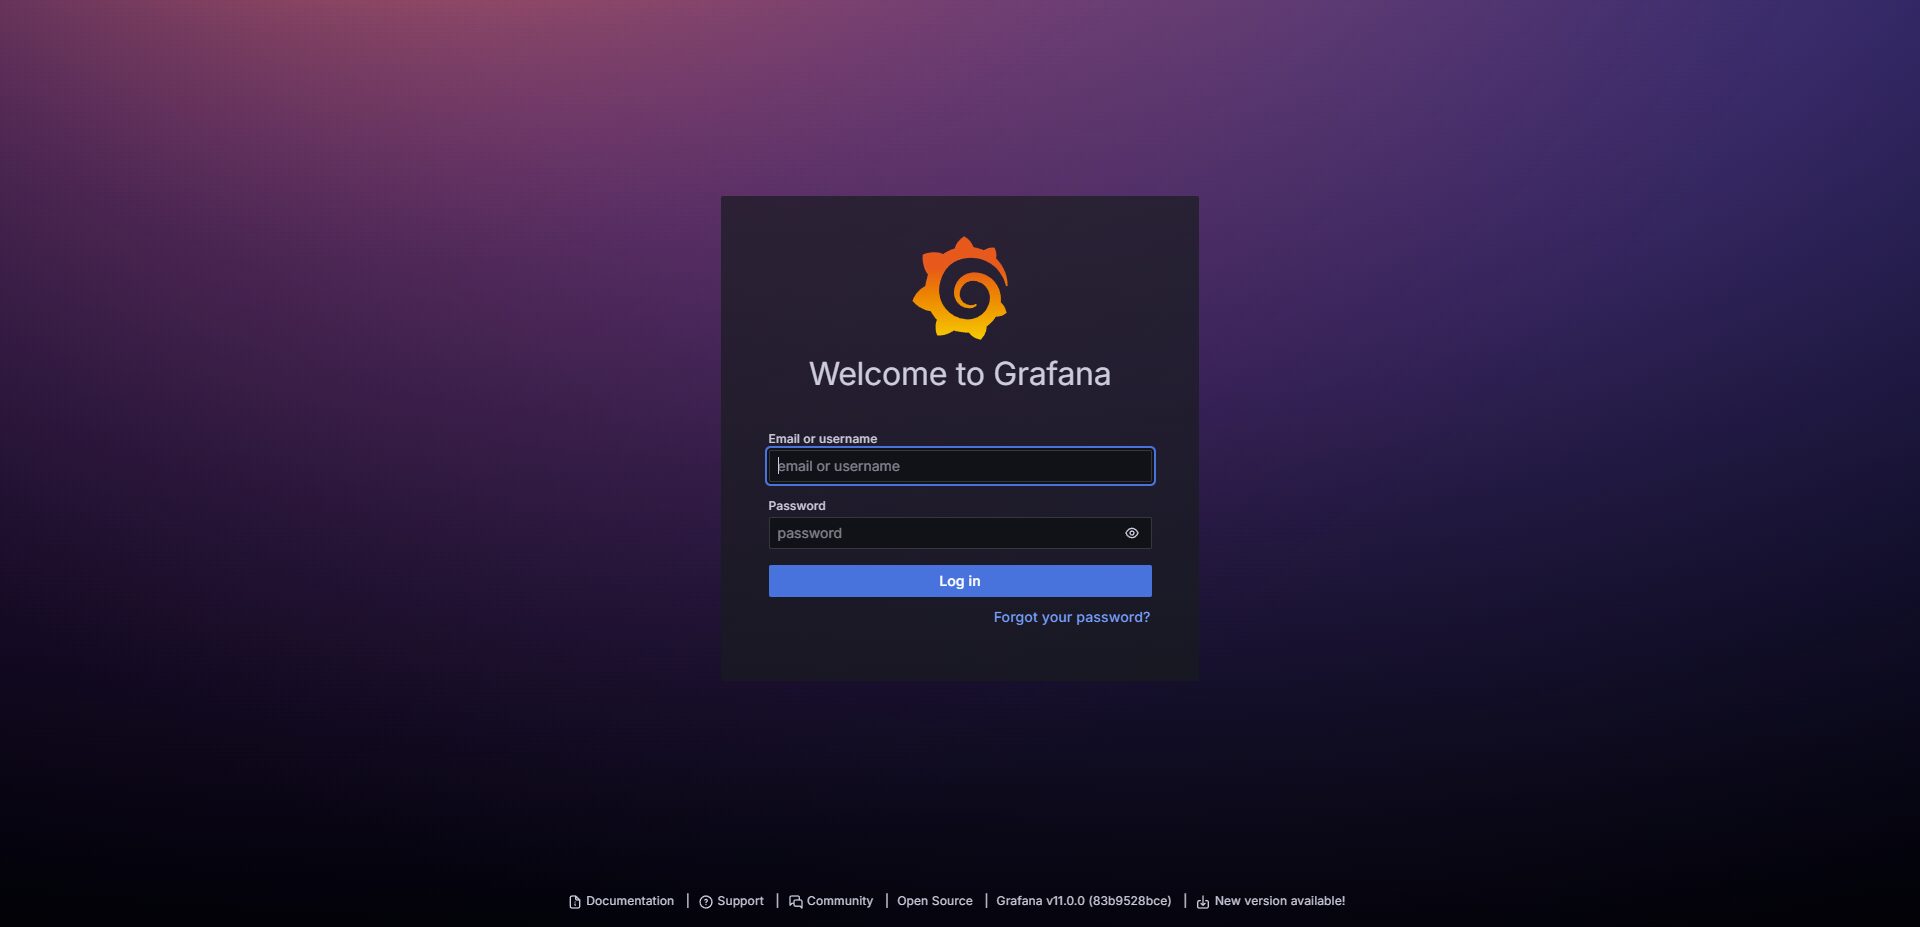
1. Grafana runs on port 80. As with the Prometheus Dashboard, the dashboard can be accessed by using the Kubernetes Port Forwarding Command or setting up an ingress to handle the traffic. Default Username: admin Password: prom-operator
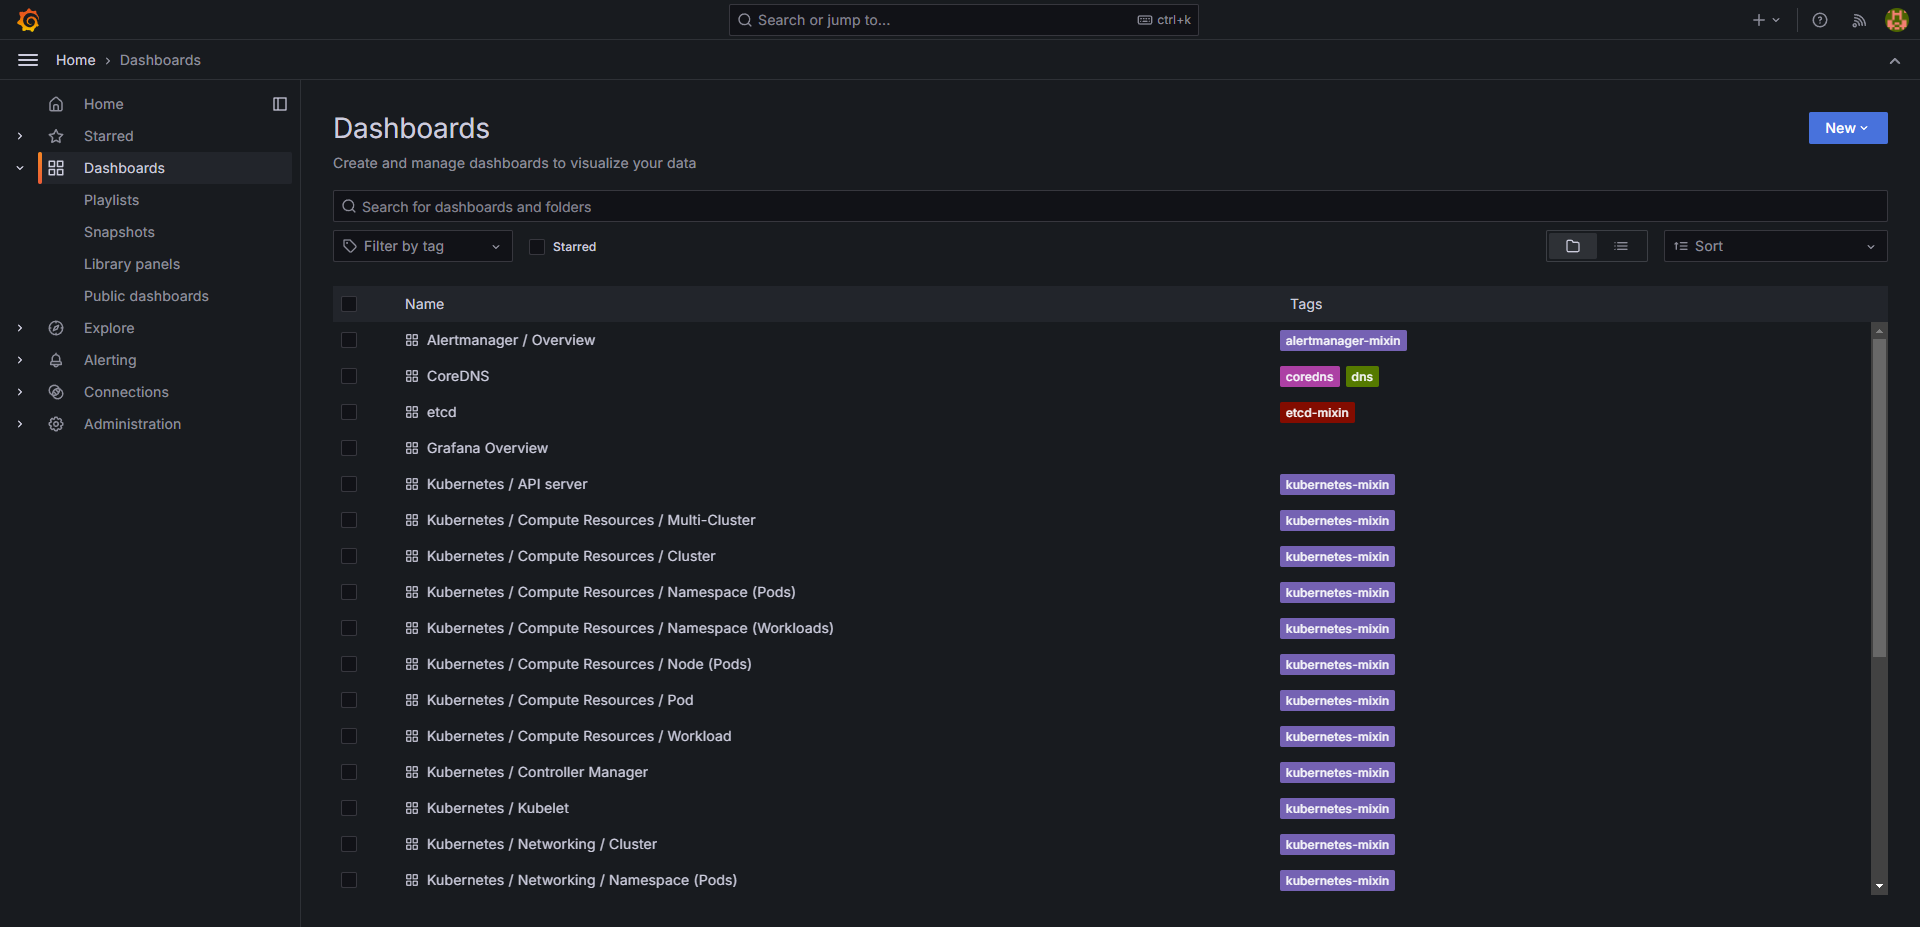
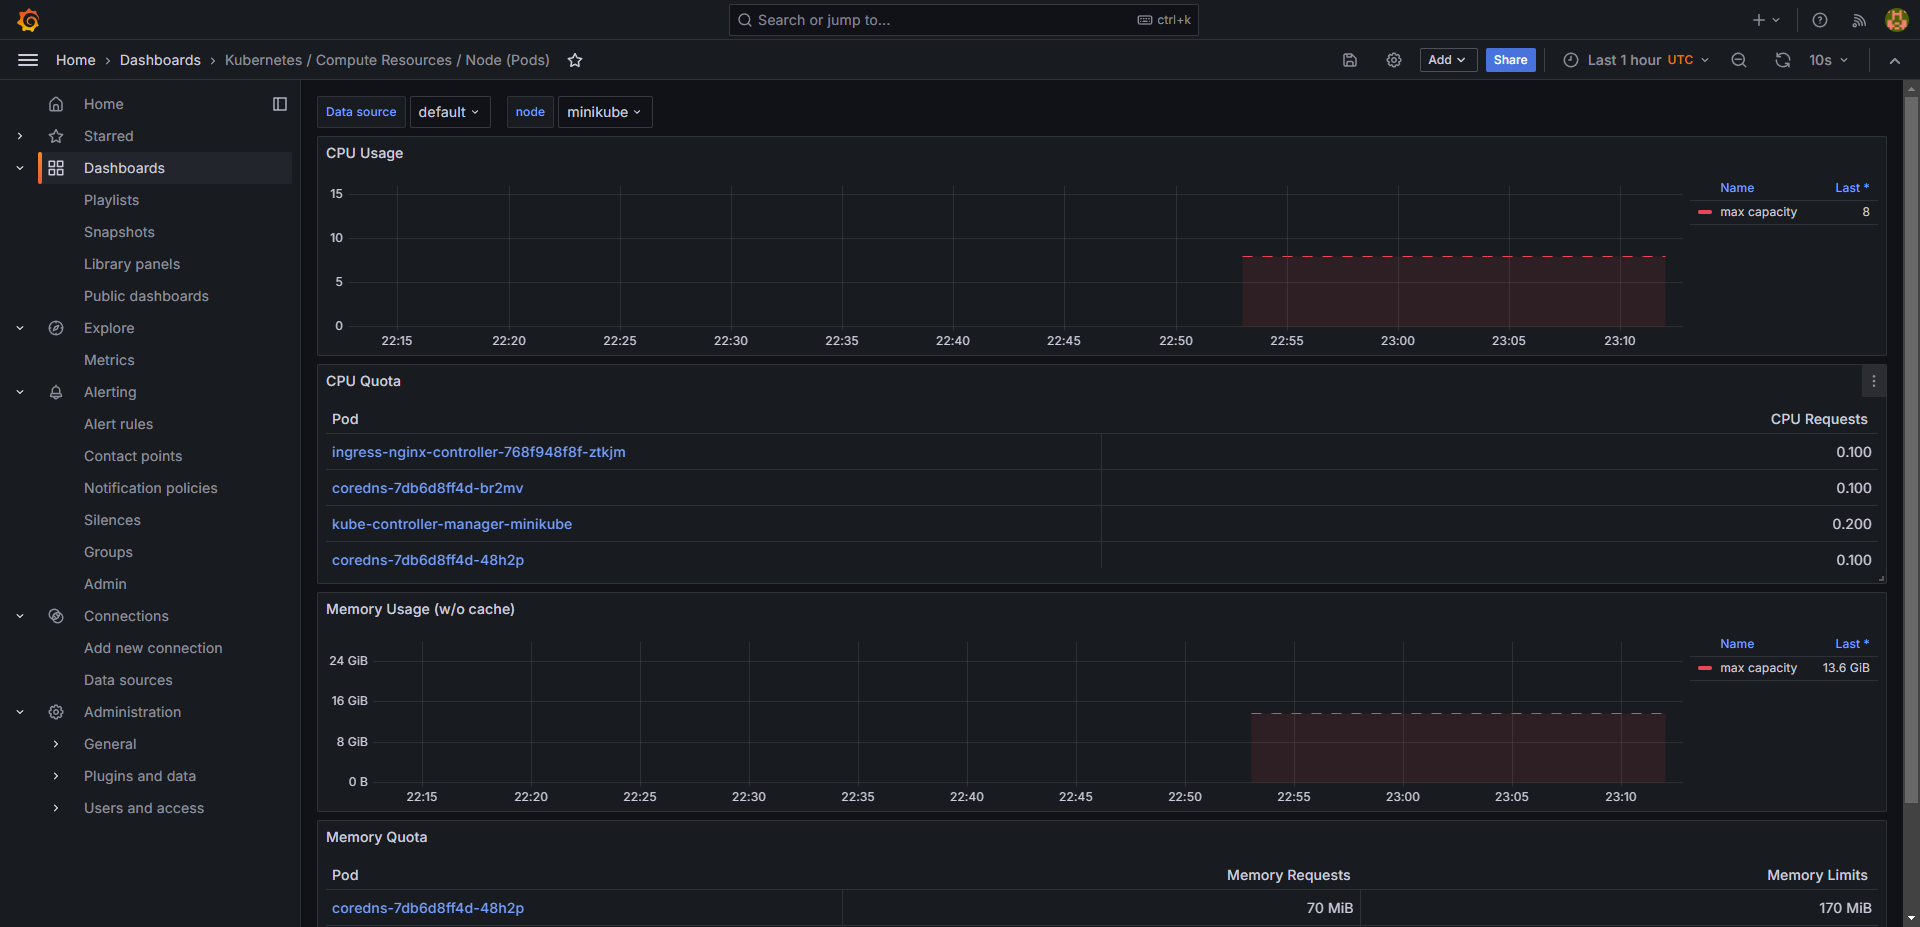
2. The dashboard graphs in Grafana displays data collected from Prometheus. CPU, RAM, Network information, disk usage. Each dashboard section divides down data by information in the full cluster, pod information, Persistent Volumes, etc. 

Setting up AlertManager notifications to email
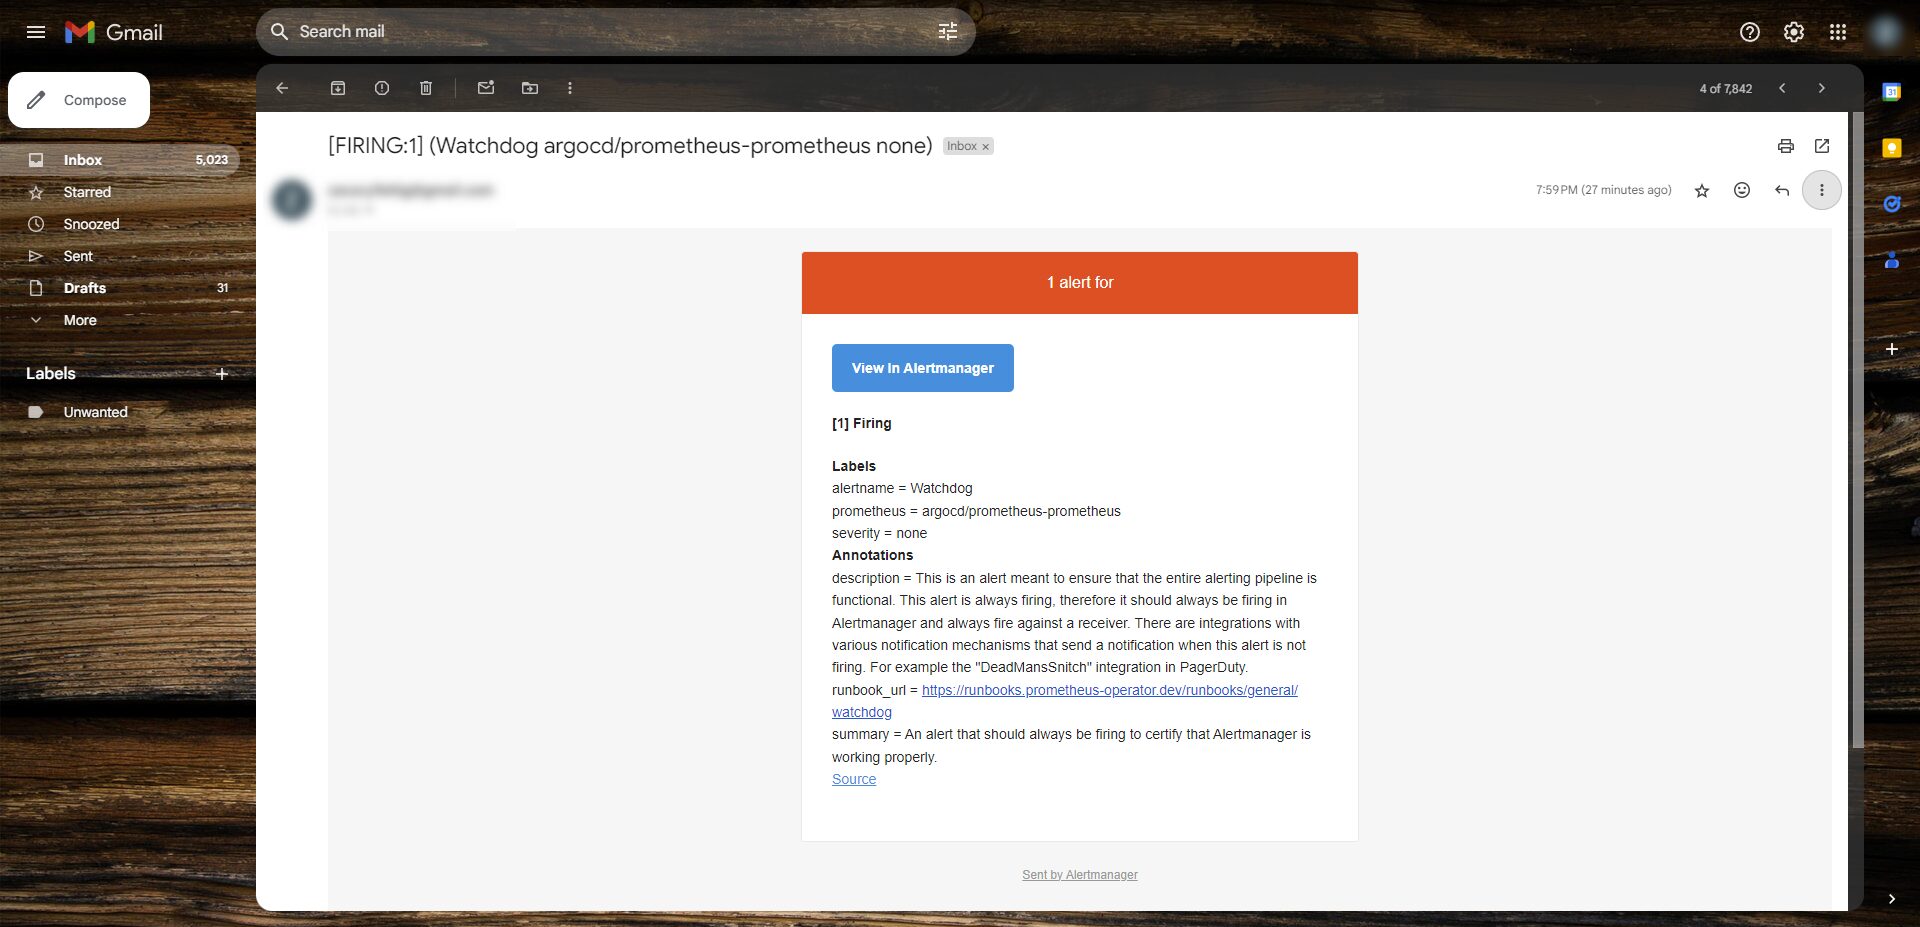
Prometheus AlertManager will send alert notifications when an alert threshold is triggered. The alerts can be configured to send through. email, slack, MS Teams, etc.
Instructions will demo Gmail, but will be similar for other platforms.
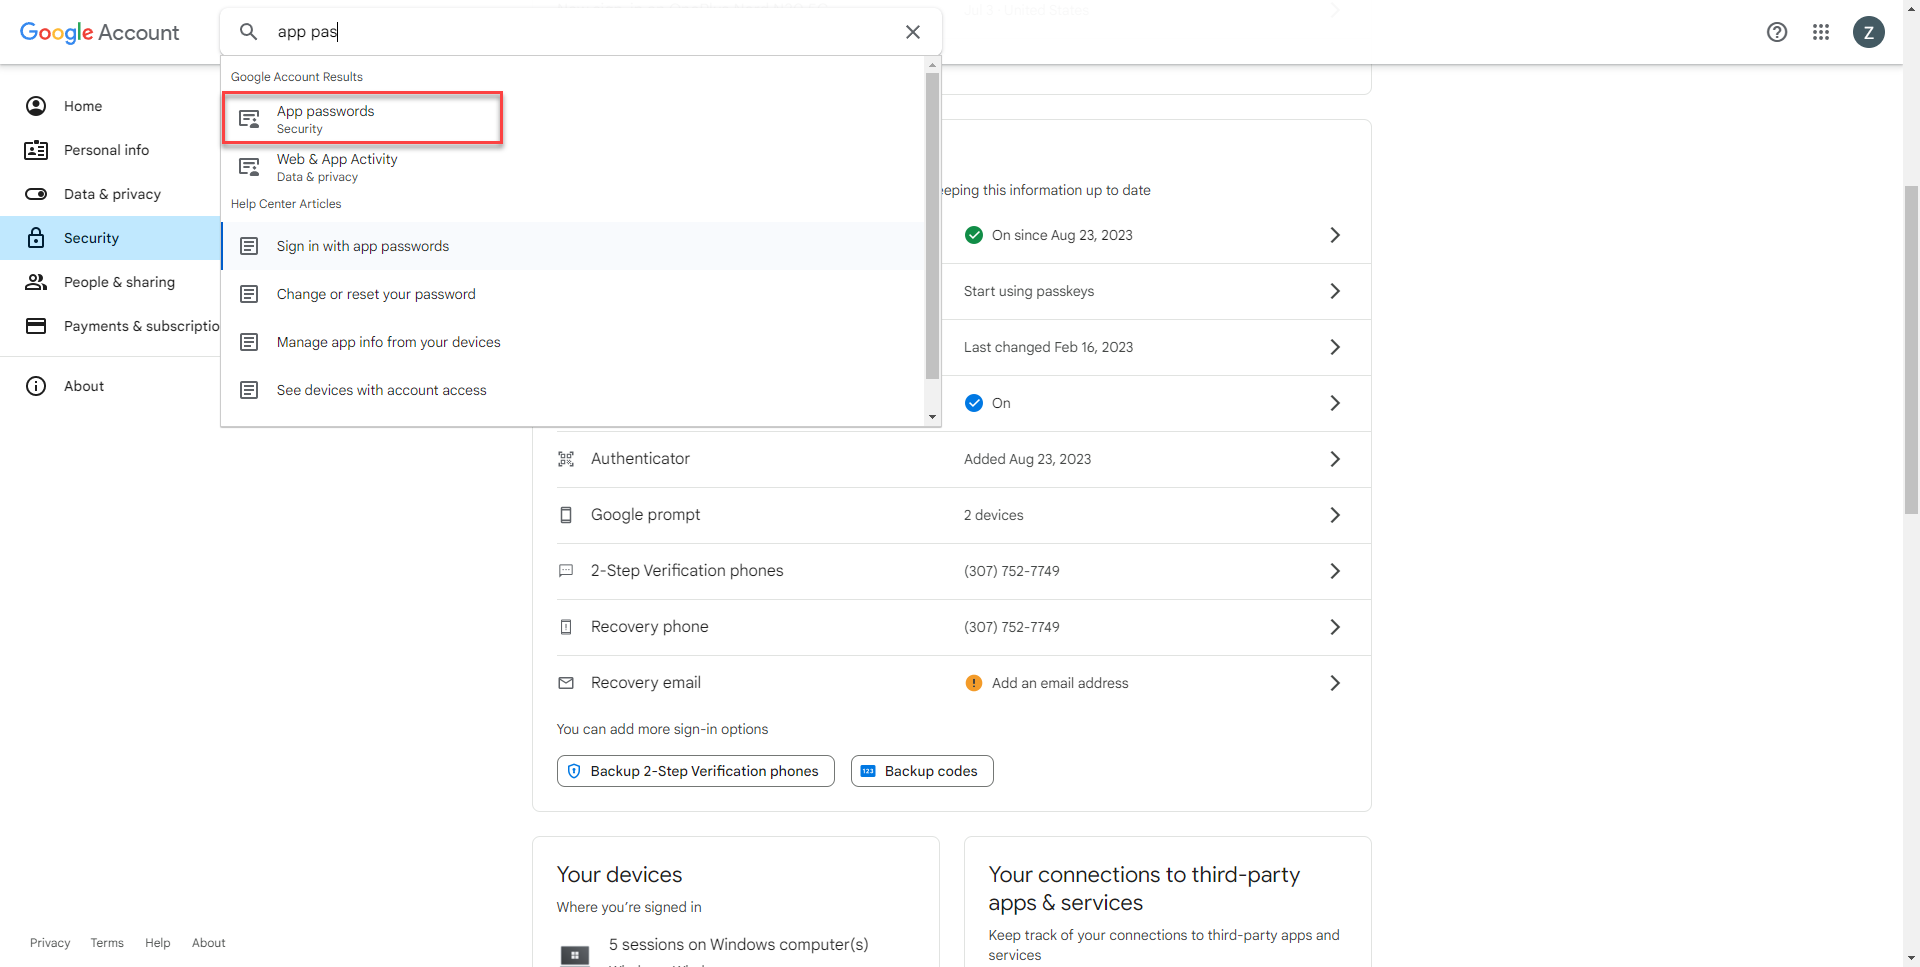
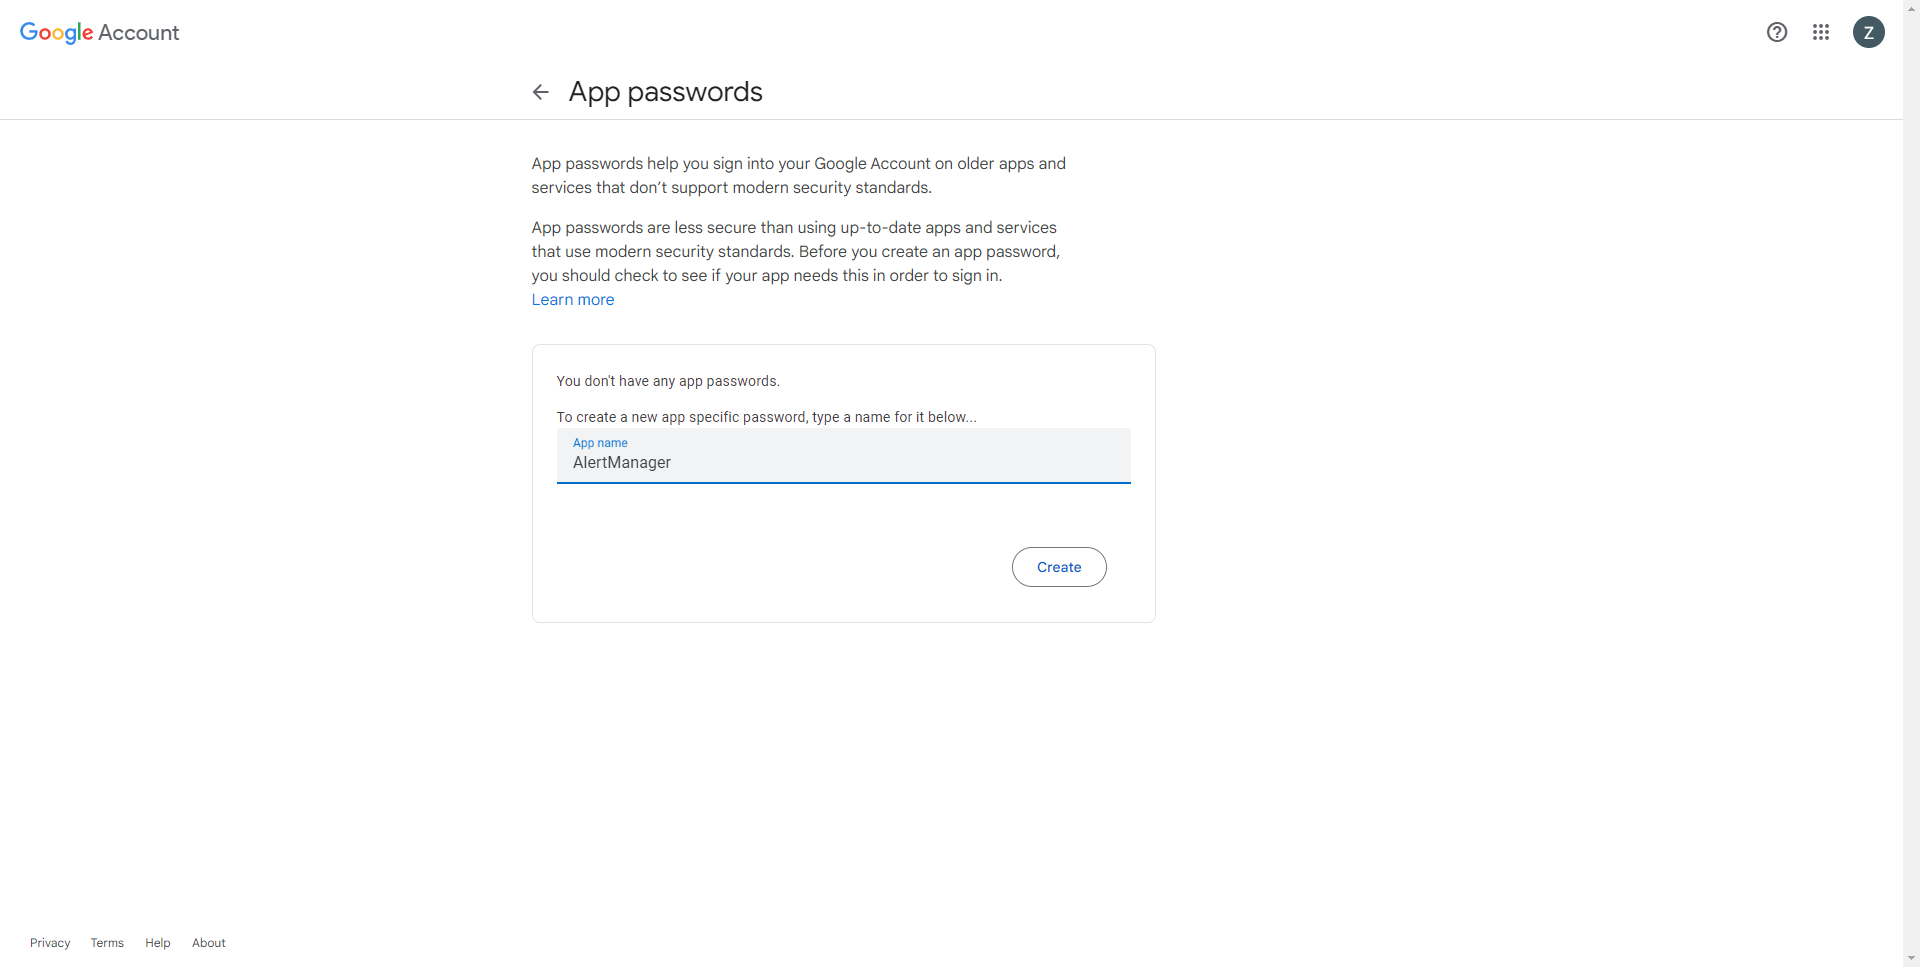
1. Select app passwords in Google Account Settings.
2. Enter name for app password
3. Password will display after selecting create. Copy the app password for use.
Prometheus Values File Changes
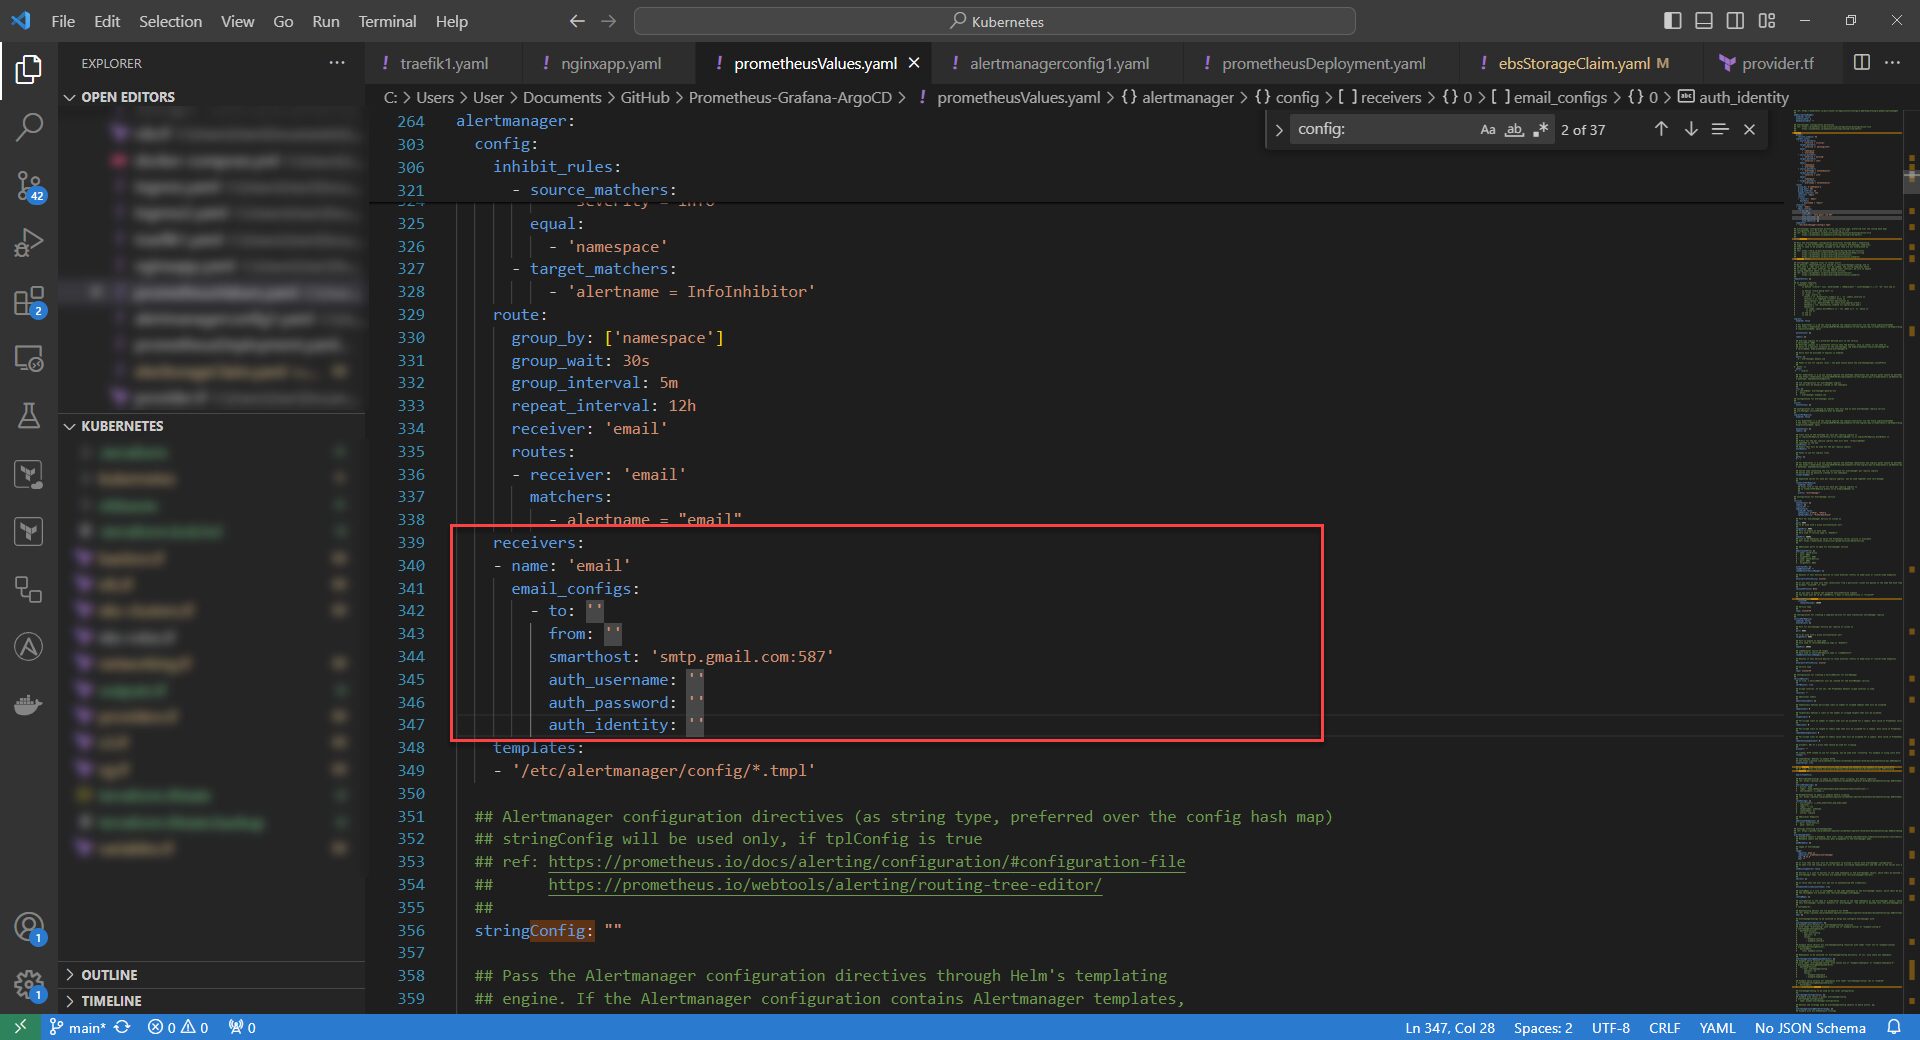
1. Fill out Email Section in prometheusValues.yaml with your email information. Email section is under the Alertmanager configuration directives heading. 
2. Push the config to a private repository configured with ArgoCD/Prometheus Deployment. Re-apply the application file to apply the new changes to the values file.
Command: kubectl apply -f .\prometheusDeployment.yaml
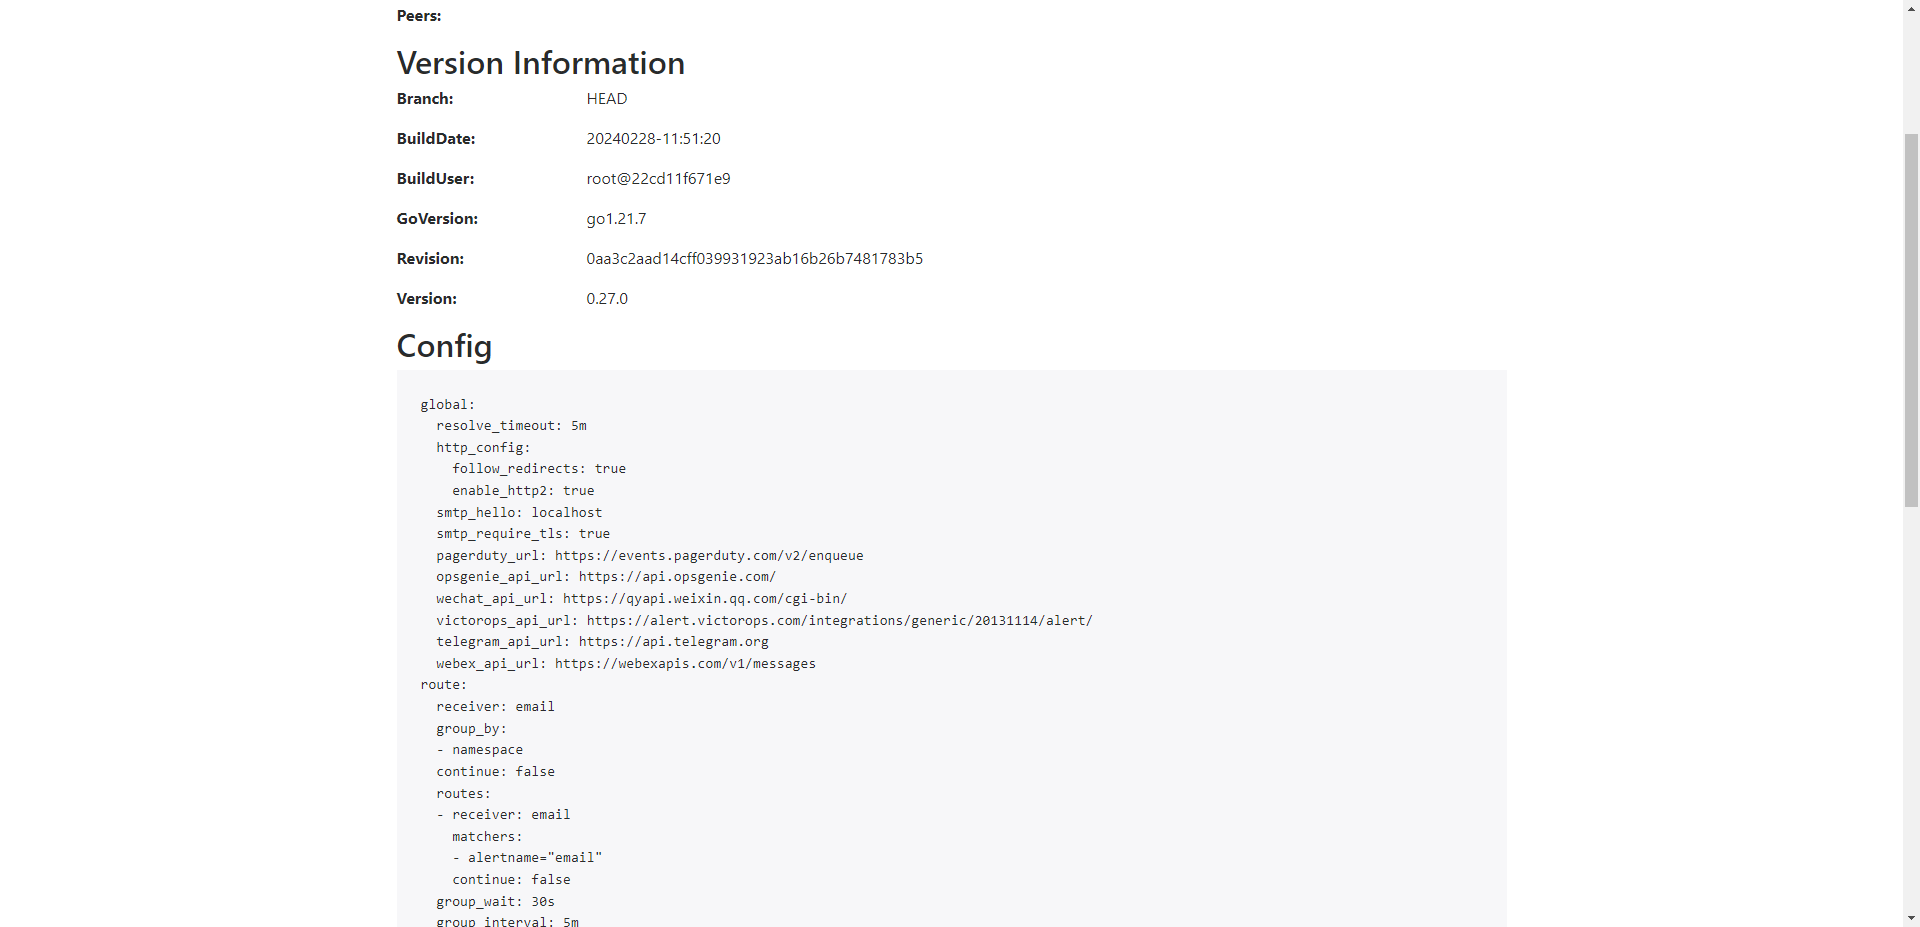
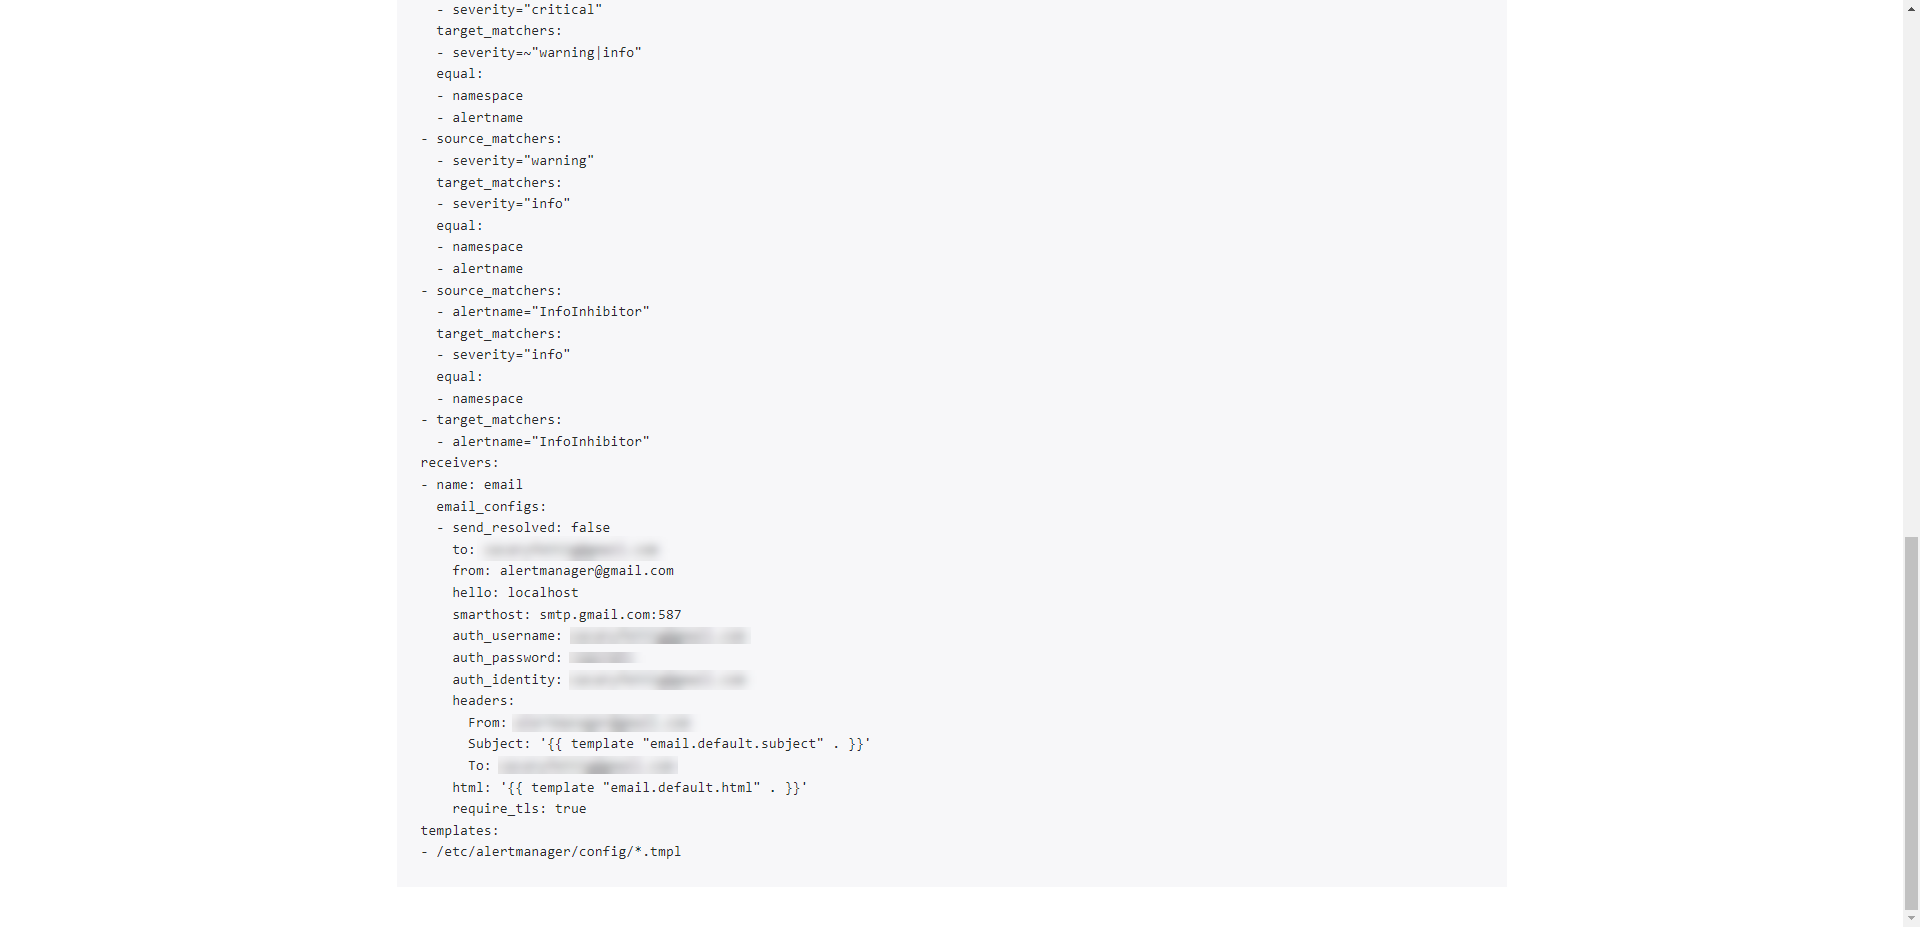
3. Alert Manager Config will reflect in AlertManager Dashboard on the status page.

4. Alerts are configured to send an email when a problem occurs.
Checking Logs With Loki
Installing Grafana Labs Loki
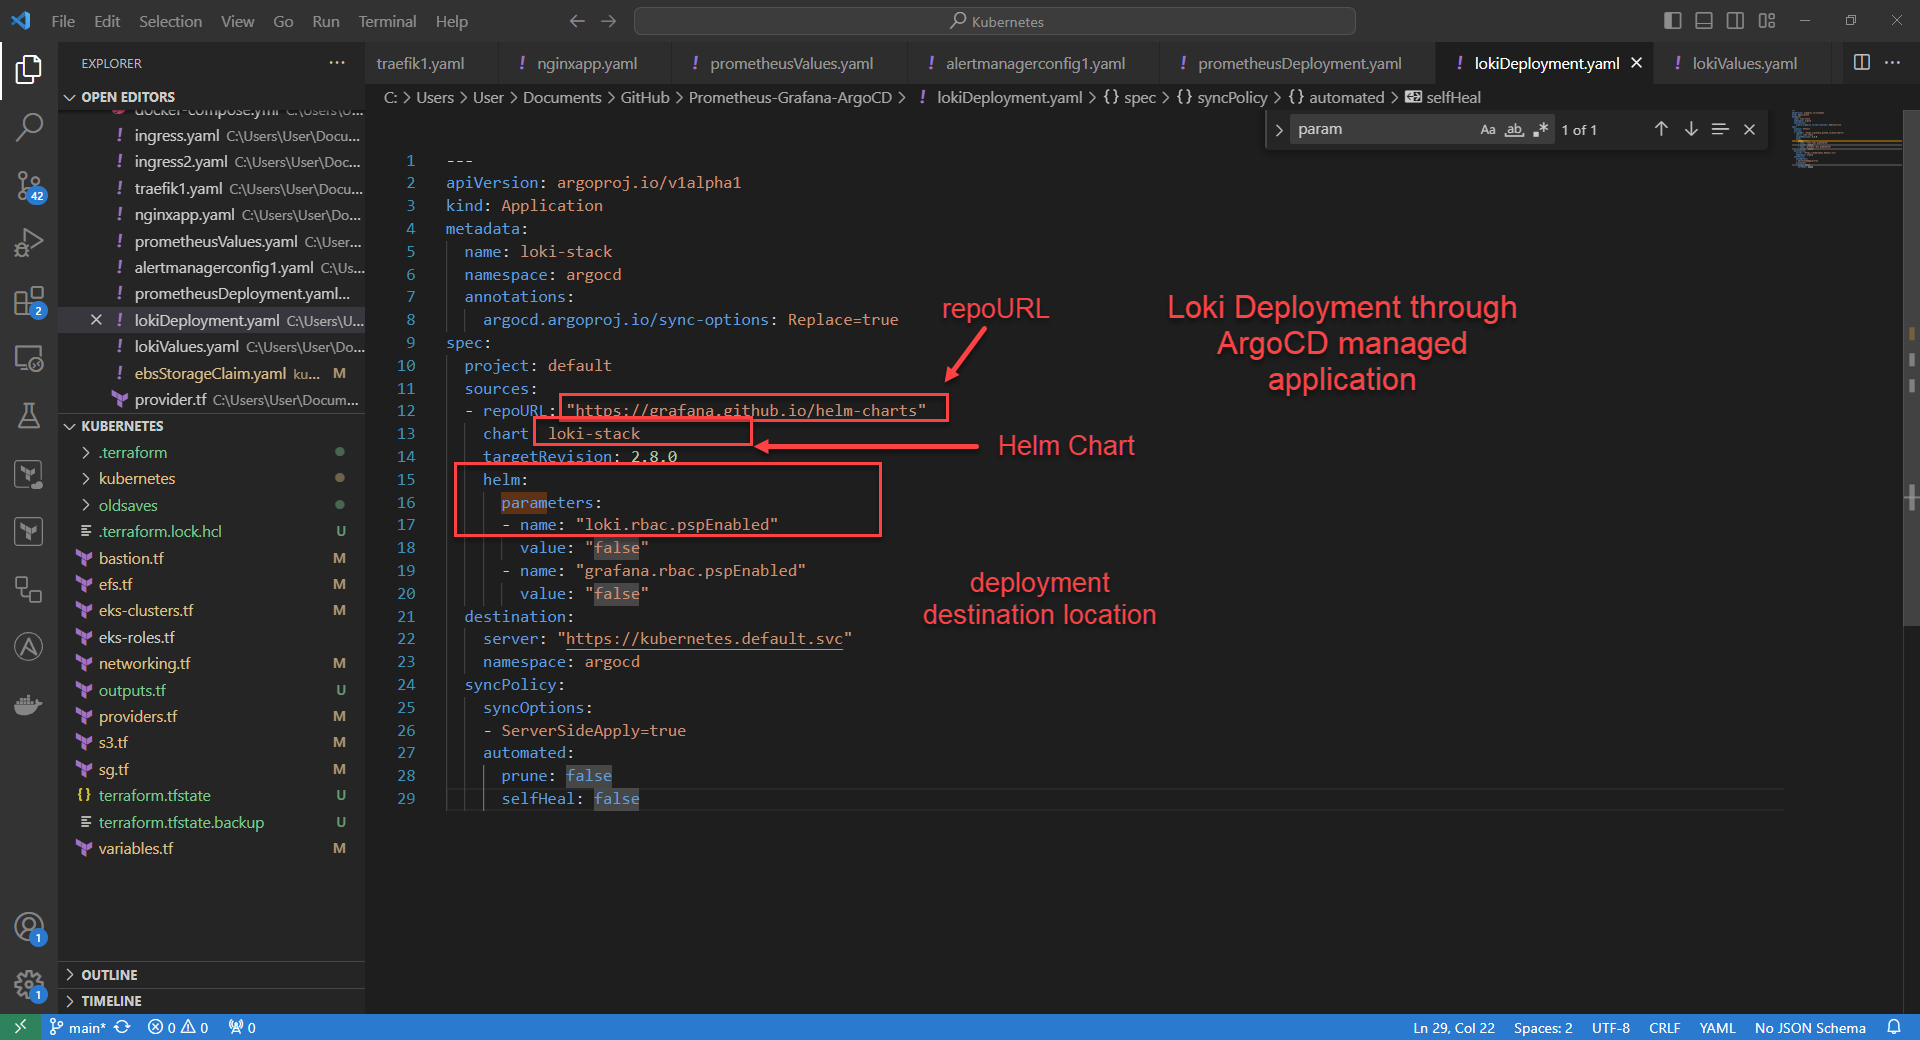
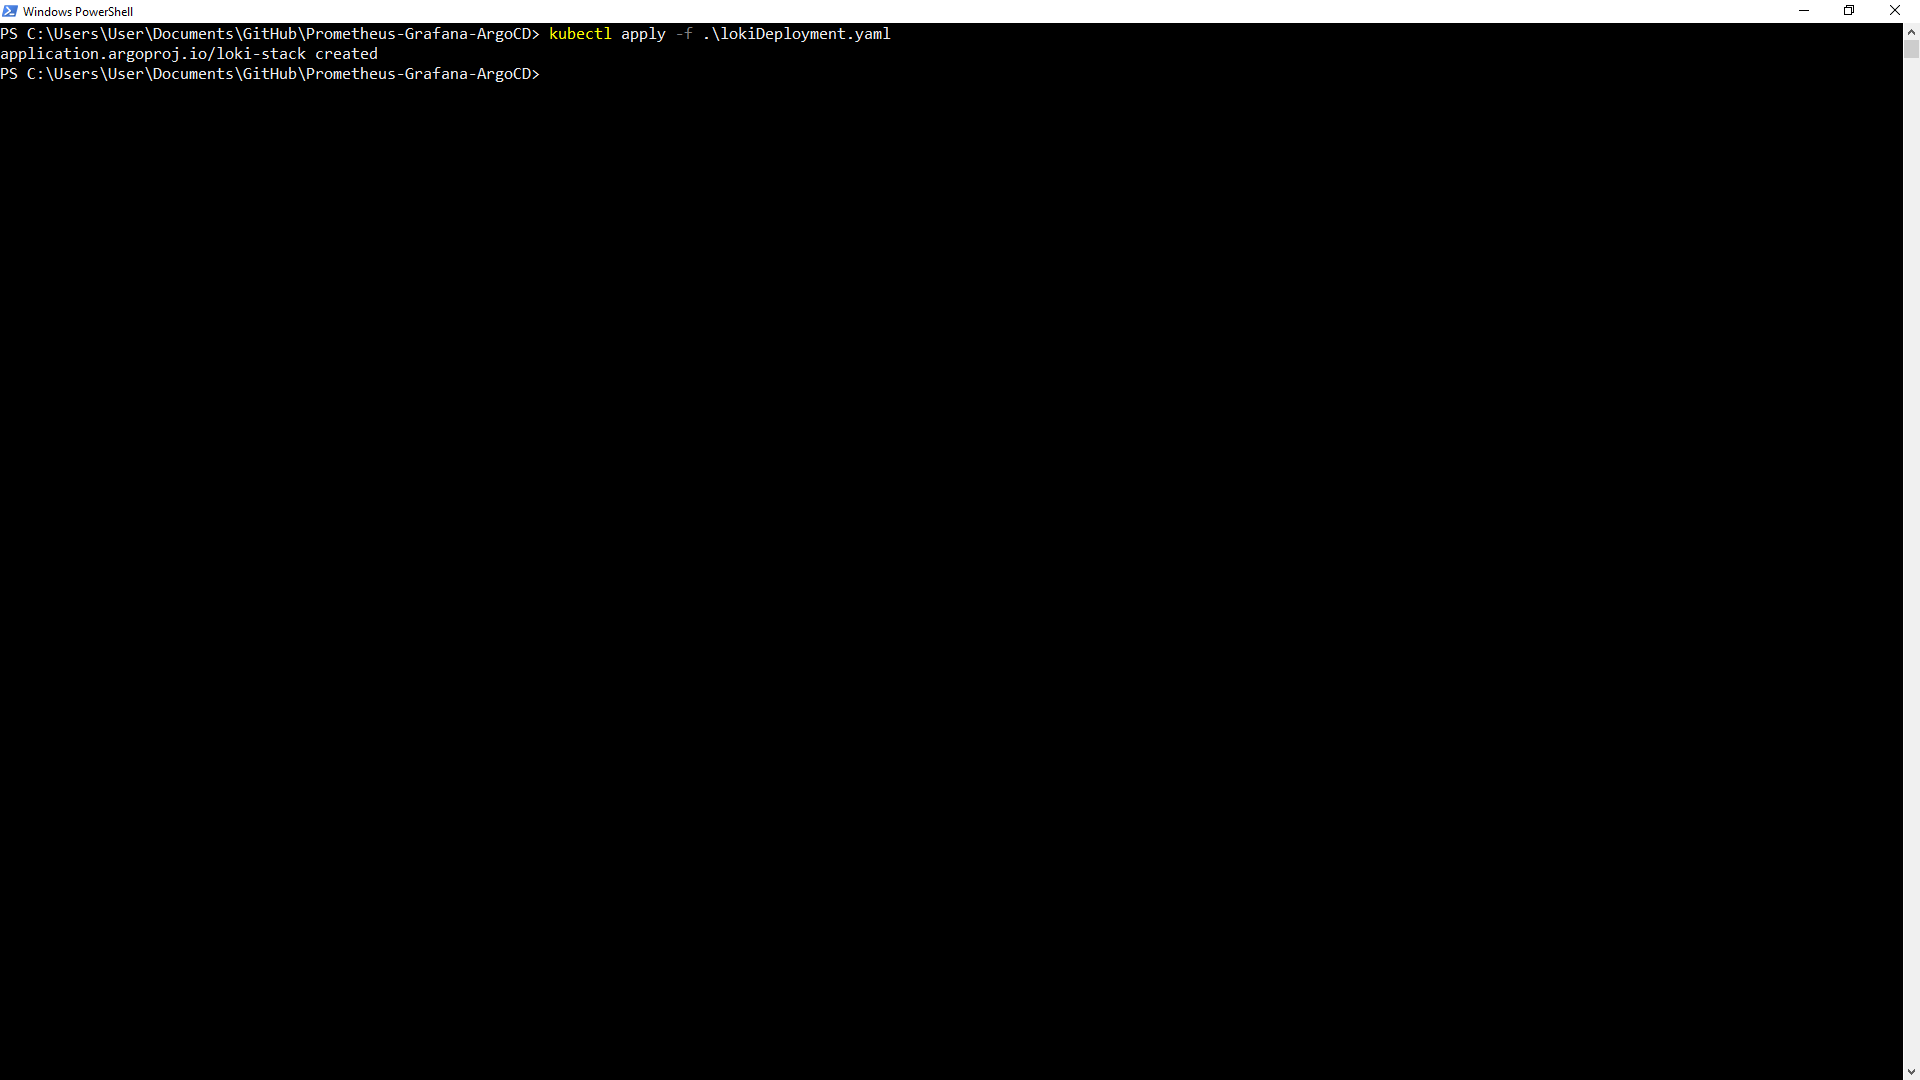
1. apply the lokiDeployment.yaml config file to the cluster. This will install the helm chart with loki and Promtail Agent.

Command: kubectl apply -f lokiDeployment.yaml
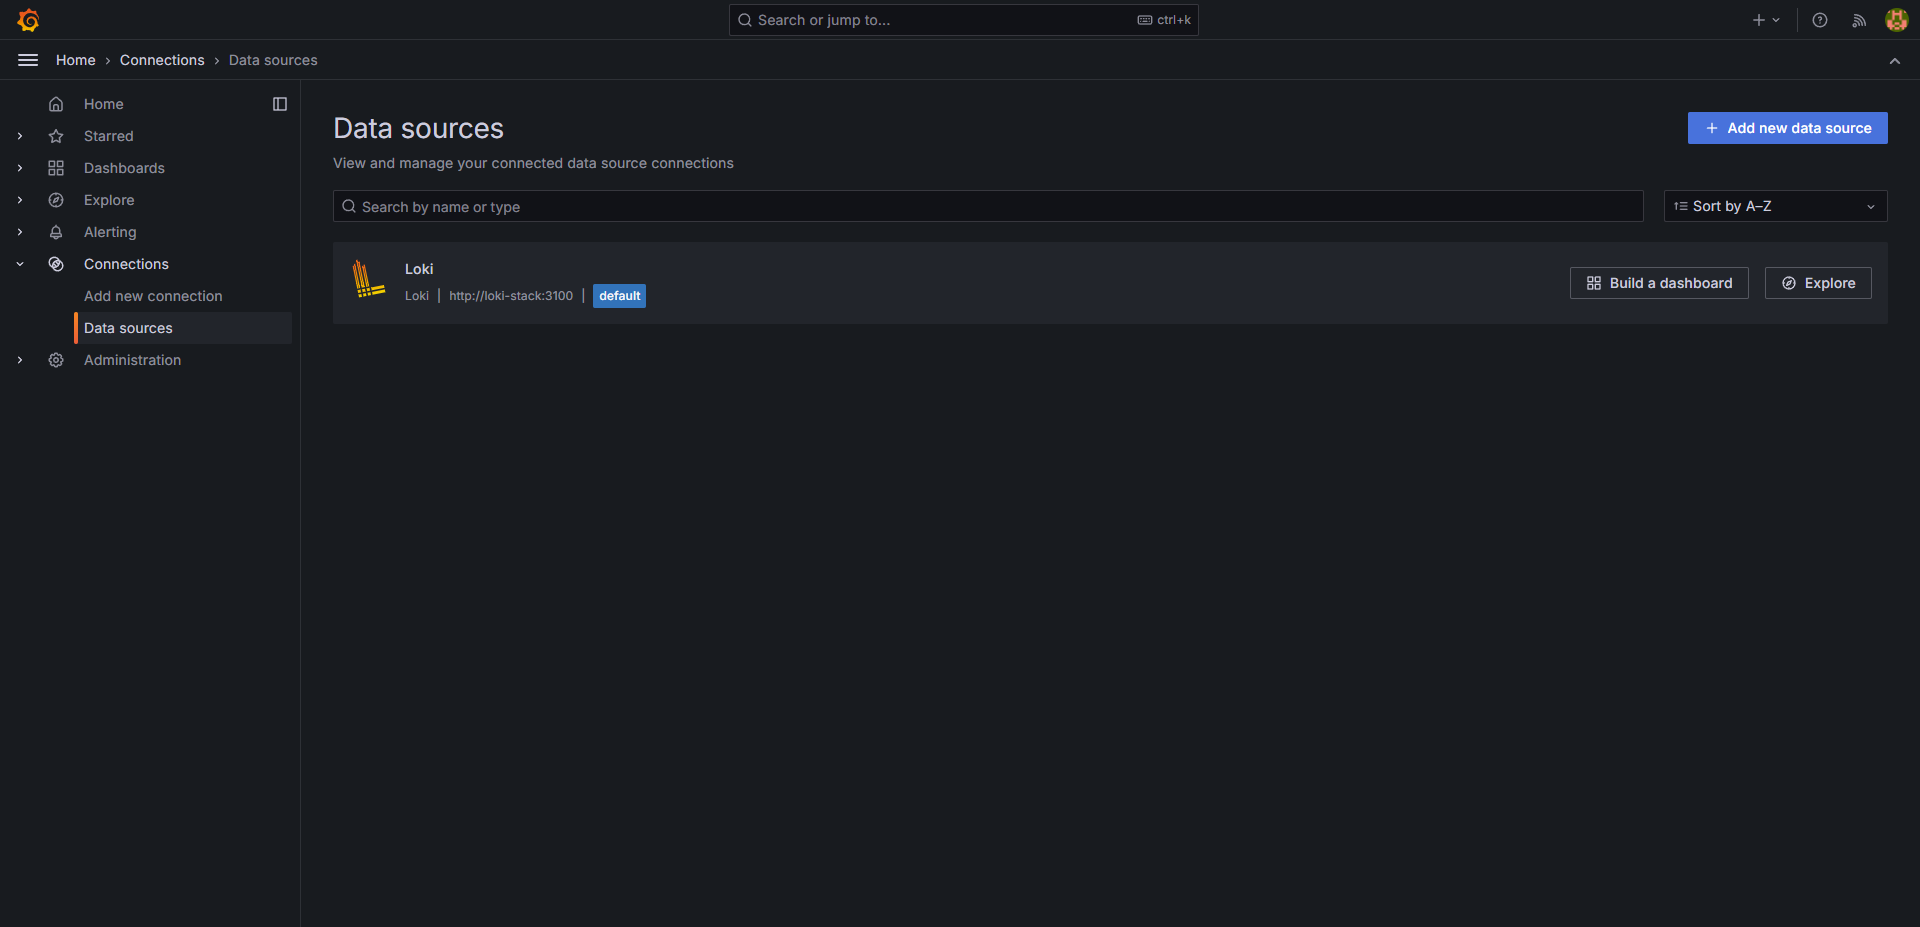
2. ArgoCD will will show the successful application deployment and Loki will automatically show up as a Data Source in Grafana.

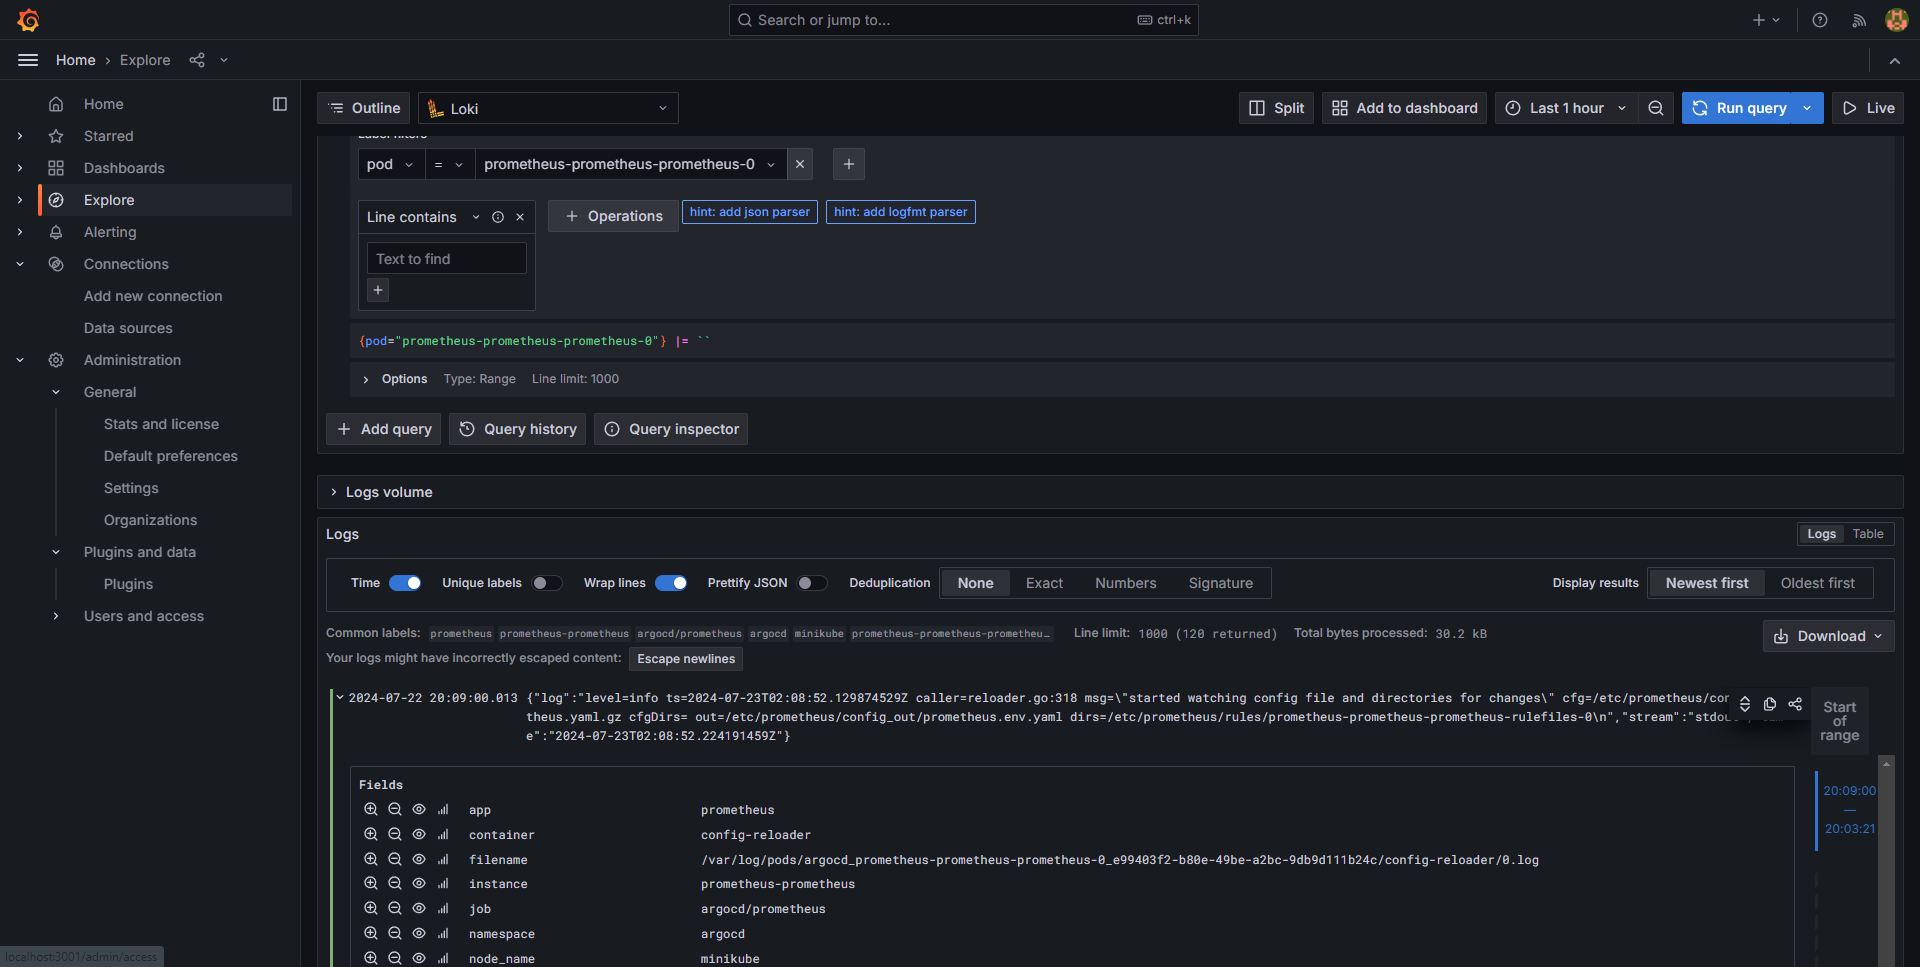
3. In Grafana GUI under the Explore Tab, logs from cluster resources can be queried. After making query selections select run query at the top right to view logs. Logs include app, container, namespace, pod, node, etc. Clicking on the log shows more detailed information.